
Use case example of a health system looking to expand cardiology and Cath lab services.
Data has immense potential to help healthcare leaders make informed decisions in a dynamic healthcare environment. For data to be actionable, however, leaders need the ability to aggregate and present the right data in a way that tells a clear and compelling story.
To demonstrate how analytics can help inform vital organizational decisions, this case study discusses a fictional health system in Omaha, Neb., looking to grow its cardiology practice and cardiac catheterization (Cath) lab services. Questions the health system’s leaders should answer include:
- Where should we look to expand?
- What are other organizations doing and how do we compare?
- What patient volumes could we expect?
- What will the revenue implications be?
- How will it affect our costs and labor needs?
Service line planning is a complex process that involves many layers of analyses. This example highlights how data analytics can help healthcare leaders develop optimal growth strategies.
Step 1: Pinpoint market opportunities
Source: Strata’s All-Payer Claims Dataset — Internal EMR Volume Data
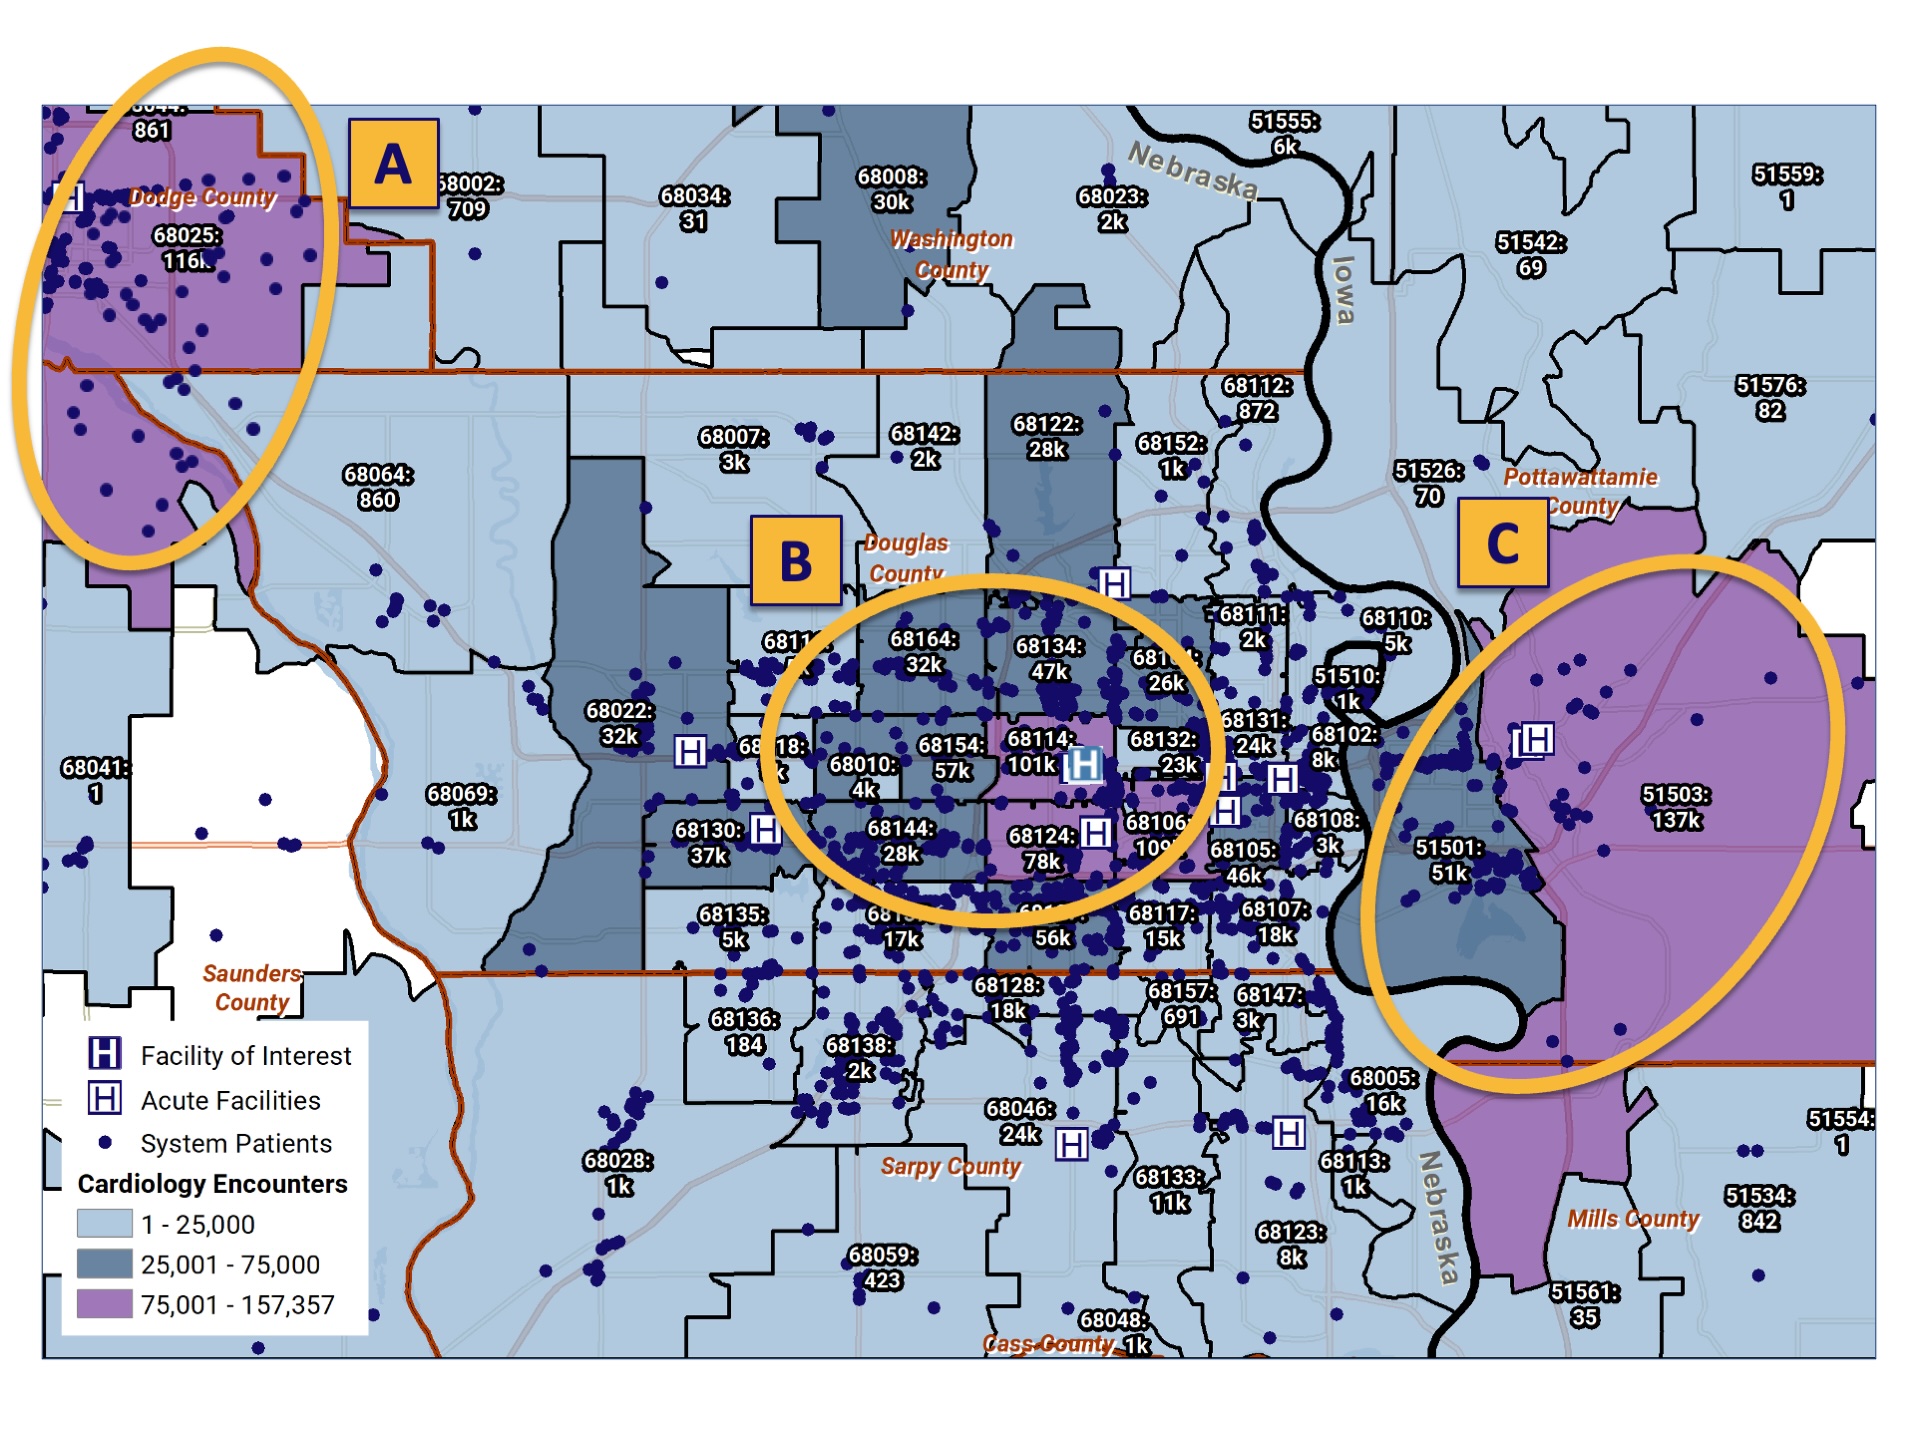
To understand what’s happening in the market, the first step is to analyze cardiology patient volumes across the service area. A spatial analysis (as shown here) allows healthcare leaders to visualize market data. The map overlays electronic medical record (EMR) data on where the health system’s current cardiology patients live, with reimbursement data on all cardiology patients in the area.
The health system’s primary hospital, ABC Medical Center, is designated by the blue “H” in the center of the map, while the others indicate competing hospitals. The blue dots are current patients, and the shaded areas reveal concentrations of all individuals who received a cardiology diagnosis within a two-year period, drawn from All-Payer Claims data.
The yellow circles indicate three zones where high volumes of cardiology patients are receiving care from other providers. These are areas the health system can target for growth.
Step 2: Project growth potential
Source: Strata’s All-Payer Claims Dataset
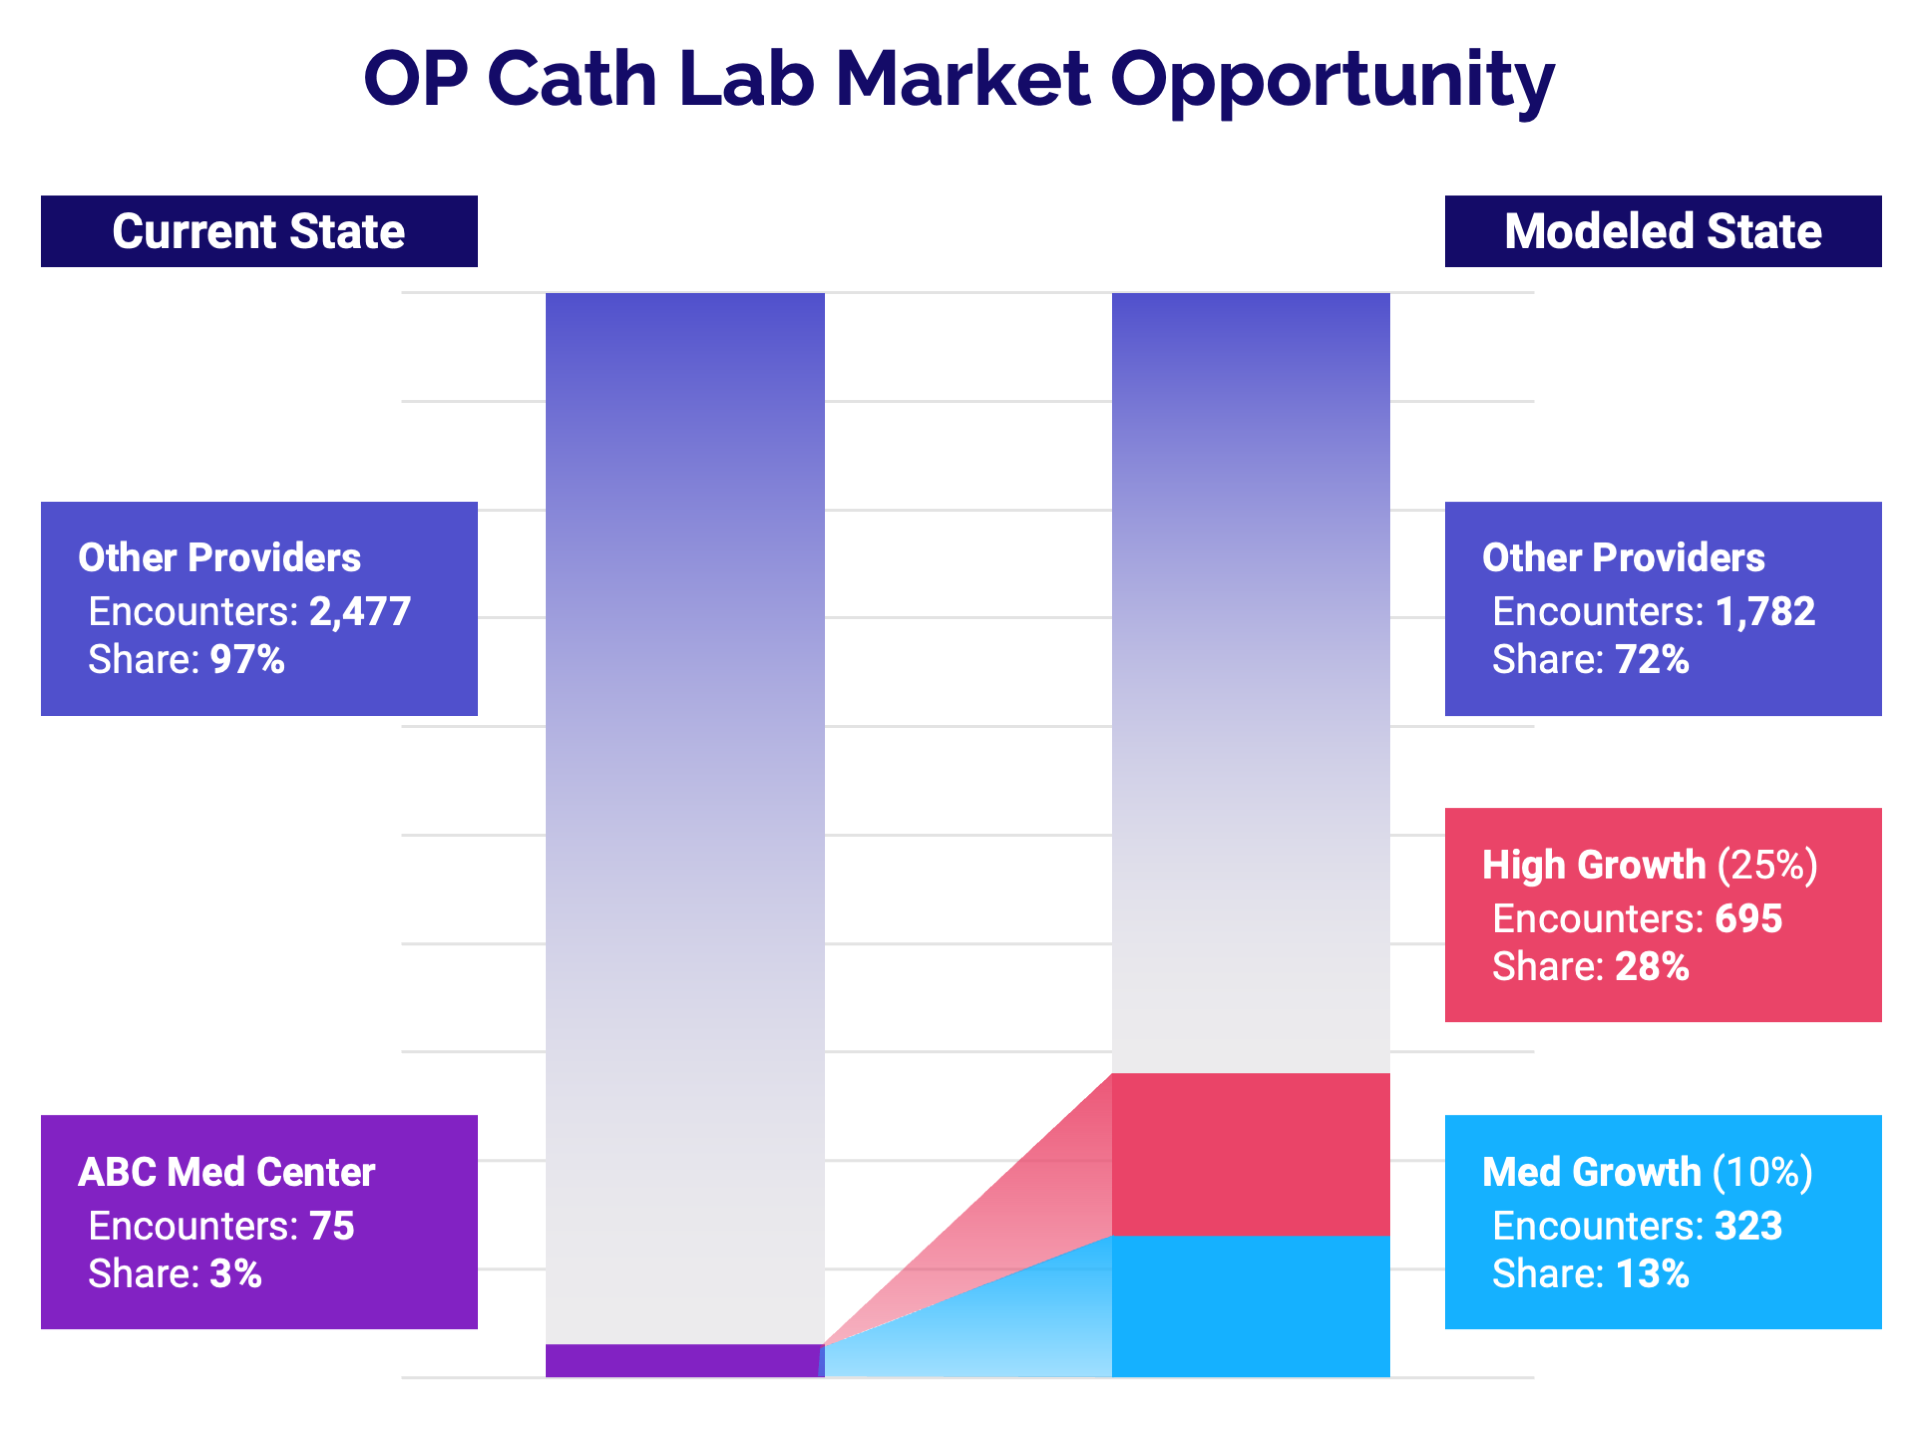
By analyzing claims data, health system leaders can more precisely pinpoint growth opportunities. The first stacked bar chart compares ABC Medical Center’s cardiac Cath lab patients versus patients going elsewhere for those services in zones B and C. It shows ABC Medical Center has significant untapped potential, with just 3% of the market share in those areas.
Healthcare leaders can then project growth opportunities. The second bar chart shows a medium- versus high-growth scenario. The health system would have an estimated 13% of the market under the medium-growth scenario and 28% under the high-growth scenario.
Step 3: Compare reimbursement rates
Source: Strata’s 835 All-Payer Claims Remit Dataset
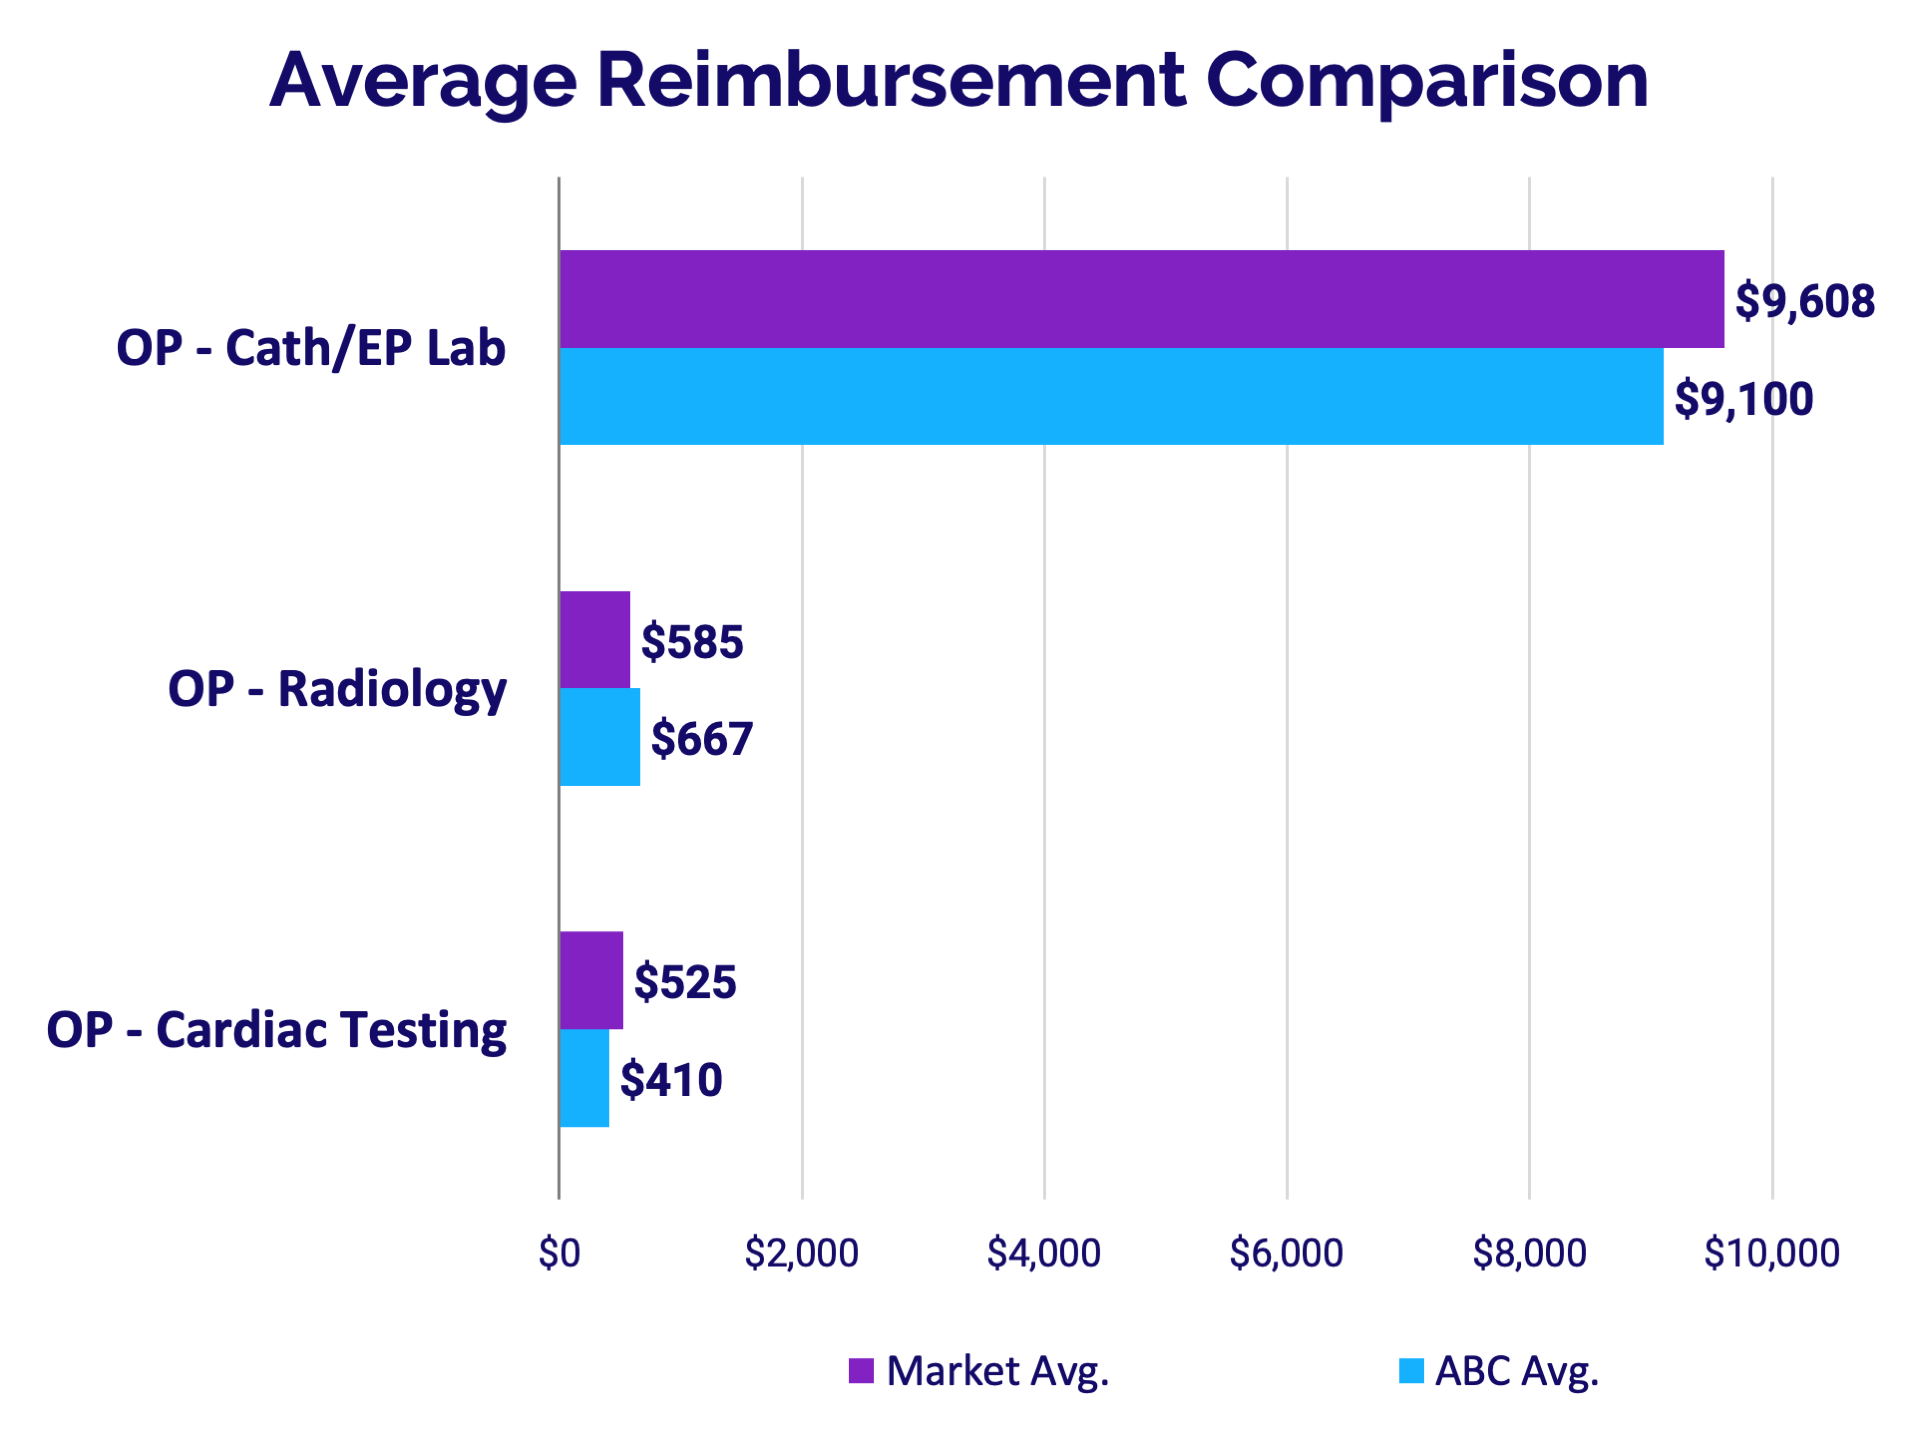
A next step in assessing the potential expansion involves diving into reimbursement rates. An analysis of 835 All-Payer Claims Remit data compares average reimbursement rates at ABC Medical Center versus market averages for selected procedures. The clustered bar charts compare reimbursements for Cath lab, radiology lab, and cardiac testing procedures in zones B and C.
The outpatient Cath Lab analysis shows that ABC Medical Center is getting more than $500 less per encounter compared to the market average — at $9,100 versus $9,608. The health system’s leaders can use this information to negotiate better rates with healthcare payers and improve the overall revenue potential for expanded Cath Lab services.
Step 4: Use cost modeling to illustrate economies of scale
Source: AxiomTM Comparative Analytics
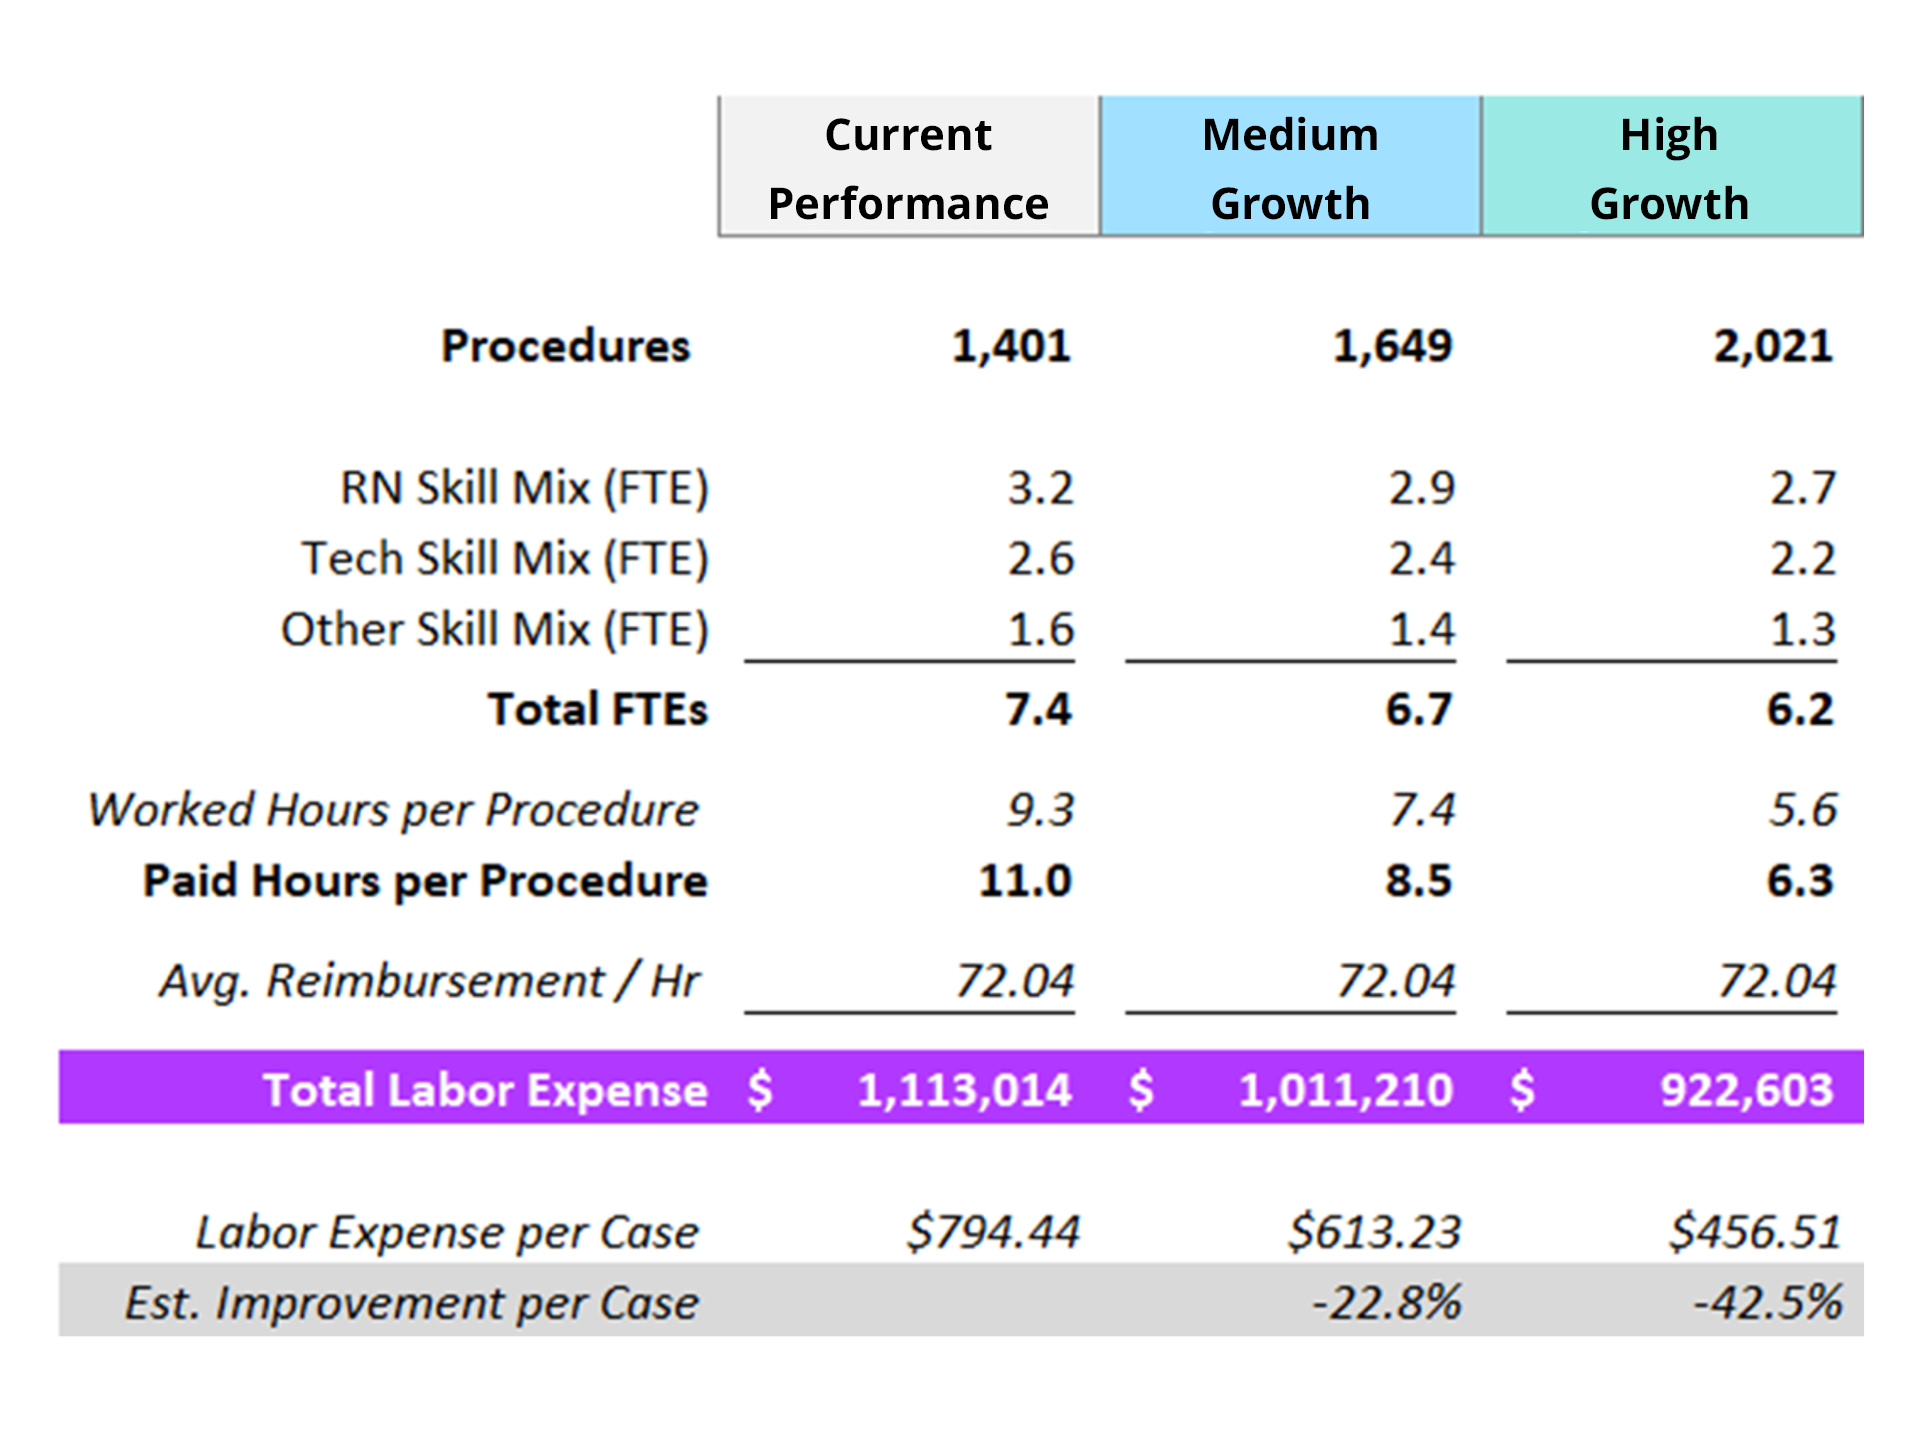
Another step in evaluating growth opportunities is to project costs. This cost model examines externally benchmarked labor costs, broken down by registered nurse (RN), technologist, and “other” clinical staff skills mix to determine total full-time equivalents (FTEs) needed under both growth scenarios. Under the high-growth scenario, for example, the health system would improve efficiencies and reduce FTEs from 7.4 to 6.2.
The analysis then calculates how those FTEs would translate to Worked and Paid Hours per Procedure. Paid Hours per Procedure would decrease from 11 to 6.3 under the high-improvement scenario, which would drive down labor expenses more than 42%, to $456.51 per case. With these calculations, healthcare leaders can demonstrate labor cost savings that would result from expanded Cath lab services.
Step 5: Assess overall opportunity
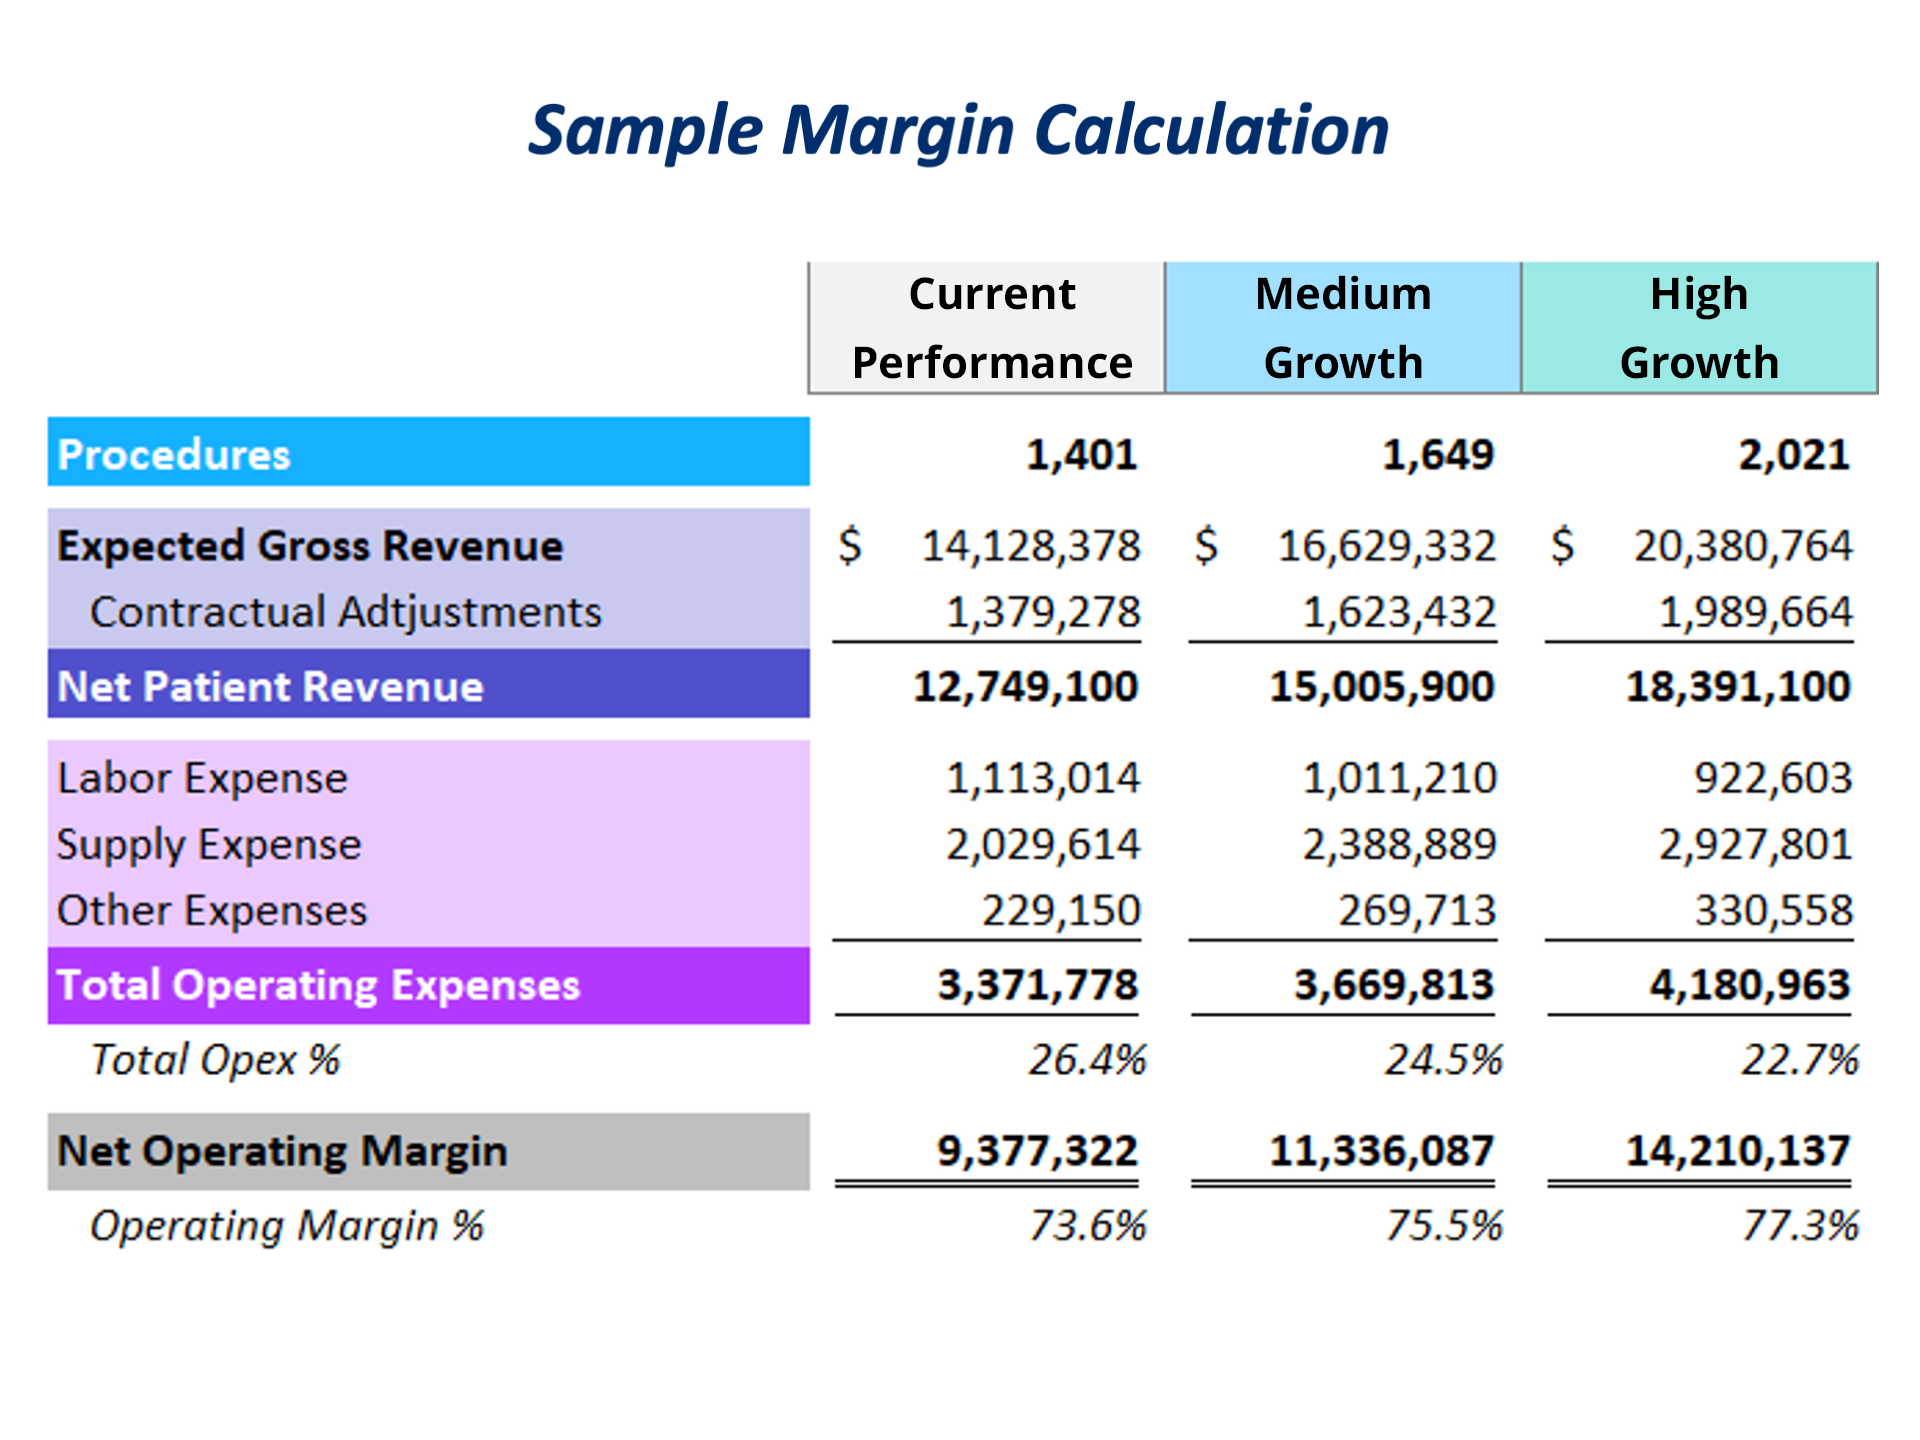
Source: AxiomTM Comparative Analytics
Lastly, healthcare leaders can combine what they have learned for an overall view. This financial model compares Net Operating Margin projections for the current state versus medium- and high-growth scenarios. Under the high-growth scenario, Net Patient Revenue would increase approximately $5.7 million, Labor Expenses would decrease $177,400, and Net Operating Margin would grow $4.8 million.
Armed with these data and visualizations, healthcare leaders can provide stakeholders a compelling business case to expand cardiology and Cath lab services into the target areas.
Learn about Strata Decision Technology’s Data and Intelligence solutions here.