• Reducing marginal expenses
• Conventional outside financing
• Trying to grow current services
• Adding new services
• Recruiting new physicians
• Or combinations of all the above.
• A choice of last resort is finding a neighboring urban hospital to rescue you.
Reducing marginal expenses
Reducing marginal expenses may also be an option and may be viewed as the quickest and easiest thing to do. Often, it is perceived as the only thing to do. Many SCHs pursue this option to the exclusion of others; and continued cuts can result in reduced revenue. This can create an ominous cycle that has more and more consequences over time.
You don’t have time to wait
Conventional outside financing is difficult when you are already financially weak. It buys time but doesn’t resolve viability, and may simply prolong the inevitable. Increasing current services, adding new services, and recruiting new physicians generally require surplus cash and time. The traditional approach to these options employs traditional models and can take 18 to 24 months before you know if you were successful. Even if you make the choice of last resort, you are probably too financially weak to have any real negotiating leverage.
Playing offense, not defense
Your ability to play offense rather than defense may depend on how much time and cash you have. Regardless of where you are with these difficult decisions, the good news is that the revenue potential is significantly more than you can imagine, is available within three to six months, and there are ways to get it with little, if any, additional net cost.
Basis of additional revenue
The amount and types of all medical services are determined by patient care utilization rates, population, and demographics. Utilization rates have been collected by the Centers for Disease Control (CDC) for over 25 years and are very reliable. I will illustrate the basics in order of the easiest revenue to achieve and most quickly.
Inpatient services revenue
Inpatient medical services usually have the greatest revenue potential, have the highest profit margin of all hospital services, and are most readily available. Much of this appropriate potential is already going through your Emergency Department every day. Have you determined the reasons why you are missing admissions?
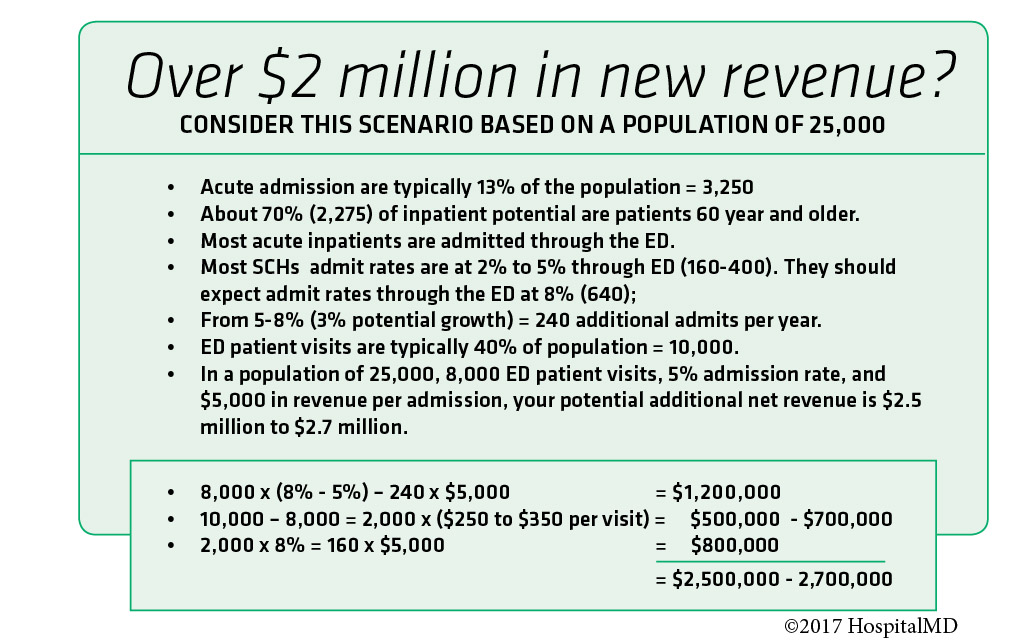
CDC benchmarks indicate that total inpatient acute admissions per year are approximately 13% of a service area population. A population of 25,000 will yield approximately 3,250 inpatient admissions going to some destination hospital. About 70% of the total inpatient potential is made up of people 60 years and older, which probably fits well within your demographics and scope of services. These 3,250 admissions, compared to your actual acute admissions, represent your growth potential. Most SCHs should expect to be able to serve 50% to 70% of this total potential.
Most acute inpatients are admitted through the ED. Adjusting for scope of services, Many SCHs admit acute patients at rates between 2% and 5%. SCHs should expect an acute admission rate through the ED of about 8%. This is a reasonable goal. If your ED patient visits per year are 8,000, you should expect to admit about 640 acute inpatients. If your actual rate is 5%, your improvement potential is 240 additional admissions. A typical average collection rate per acute admission of $5,000 would result in an additional $1,200,000 in net revenue.
Emergency service revenue
The next best source of additional revenue is ED patient volume. A service area population of 25,000 should yield about 10,000 patient visits. In our example in which your patient visits are 8,000, this suggests an additional 2,000 ED patient visits. Net collections for a SCH can vary widely depending on your payer contracting effectiveness, quality of patient registration, and the effectiveness of your patient accounts staff. One should expect a reasonable net collection of $250 to $350 per ED patient visit for an additional $500,000 to $700,000. These 2,000 ED patient visits should also result in an additional acute inpatient revenue of $800,000 (2,000 x 8% = 160 admissions x $5,000 each).
Overall Revenue Potential
The total revenue potential in this example is $2,500,000 to $2,700,000. This may seem far out of reach. But it represents performance in your service area with population you already have. You can apply these benchmarks to your service area to forecast your specific revenue improvement potential. I welcome your comments and questions.
Expect quantum results, not incremental change!
Jim Burnette is the Founder and CEO of HospitalMD. Jim has worked in healthcare for more than 20 years. His mission is to strengthen Small Community Hospitals across the nation and help them thrive in today’s rapidly changing healthcare climate. Jim is a graduate of Georgia Tech and resides in Peachtree City, a small community right outside Atlanta, GA. Contact Jim at insight@hospitalmd.com
The views, opinions and positions expressed within these guest posts are those of the author alone and do not represent those of Becker’s Hospital Review/Becker’s Healthcare. The accuracy, completeness and validity of any statements made within this article are not guaranteed. We accept no liability for any errors, omissions or representations. The copyright of this content belongs to the author and any liability with regards to infringement of intellectual property rights remains with them.
