Radiology has also historically been a significant contributor to hospital revenue – and remains so currently. However, as risk-based and capitated payment mechanisms become more commonplace, radiology is being increasingly considered a cost center to be managed, even as practices are asked to do more. Gone are the days when radiologists read within the hospital’s four walls only during “normal” business hours. Today, hospitals and health systems are creating imaging service lines that demand 24/7 finals, specialty reads and an onsite presence across all locations. Increasingly, alignment between radiology and health systems means solving for healthcare’s requirements of decreased costs, improved quality and documented high service levels that are consistently defined and delivered.
So how does an imaging service line operate in this new, rapidly changing environment without risking commoditization? Now that the radiology market continues to absorb the CMS rate cuts and prepares for the demands of a fee-for-value payment environment, radiology must not be viewed as a cost center to be managed – but rather become indispensable to its hospitals/health systems and referring physicians; a valued-added partner with innovative solutions with which to measure and prove quality, value and performance.
The “why” before the “how”
When developing a high-quality and efficient imaging service line, it is vital to have reliable data upon which to build an effective operating plan. Data must be transformed into information and insight with which to establish the starting point, as well as to build assumptions to define goals and success metrics, and finally, to monitor, report and assess the ongoing performance and impact of imaging on critical parameters like “treat to street” in the emergency department or length of stay for inpatients. Decisions must be made and performance measured using data-driven hard evidence, not opinions.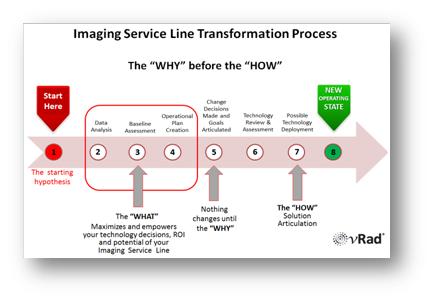
If the “why” or the goals (including analytics requirements) are not clearly defined when starting out, the “how” or solution articulation will be flawed, with the high likelihood of creating deeper misalignment between a radiology practice and its health system (See Figure 1: “Imaging Service Line Transformation Process”).
The new normal of normalization
Having reliable analytics to begin the service line process is problematic since normalizing data for insight is one of the largest challenges facing radiology today. One hospital’s “ultrasound gallbladder,” is another hospital’s “ultrasound right upper quadrant” or “ultrasound liver.” Descriptions that facilitate the protocoling process are not standard across practices, even if they are all part of the same integrated delivery networks with a common EMR. This makes drawing conclusions, applying insight and internal and external benchmarking performance difficult, if not impossible. Furthermore, tools accessible to most practices, like a radiology information system, were built to schedule and perform procedures, but not to measure quality, value or performance. While there are other data sources, including billing/payer information, health information systems data and data from the EMR, normalization challenges still remain.
The complexity of data normalization can be daunting given the number of studies and the referring physicians interacting every day with radiology departments. Yet, a standard against which to normalize and standardize must be defined to build, implement and update an operating plan.
Every hour counts
For example, insight from normalized data highlights that demand for imaging services varies greatly over a 24-hour period[i]. These hourly and shift variations in volume, modality mix, and patient type have a significant impact on creating (and staffing for) an efficient 24/7 imaging service line (See Figure 2: “A Day in the Life of Radiology: A Consolidated 24×7 View & Economic Value”). For example: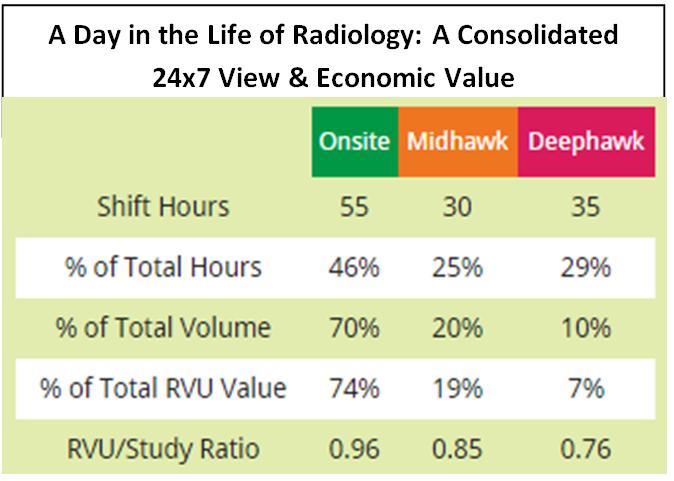
- The “deephawk” or overnight shift (Monday to Friday 12:00 a.m. to 7:00 a.m.; 12:00 p.m. Saturday to 7:00 a.m. Monday) accounts for 29 percent of working hours, yet it drives only 7 percent of total RVUs, the lowest of the three shifts.
- The “onsite,” or daytime shift (Monday to Friday 7:00 a.m. to 6:00 p.m.; 8:00 a.m.to 12:00 p.m. on Saturday) is the most productive, accounting for 46 percent of total working hours and 74 percent of all RVUs, mainly because of the concentration of interventional radiology studies.
- The “midhawk” shift (Monday to Friday 6:00 p.m. to 12:00 a.m.) accounts for 25 percent of the working hours and provides 19 percent of RVUs.
To manage and staff for these variations, radiology groups utilize a variety of tactics, some of which might deviate from the health system’s desired standard for service levels. For example, weekend inpatient X-rays may be held for interpretation until Monday morning, which impacts morning rounds, delays noontime discharge for DRG inpatients and distracts dayshift radiologists from engaging in other important outpatient-based activities.
One can argue that a more effective way to deal with off-hours – and ensure consistent service levels – is to combine the best of both worlds: onsite radiology and cloud-based teleradiology. Working with a large-scale teleradiology provider for nighttime coverage can improve service levels because the imaging volume from many institutions is aggregated to enable cost-effective delivery of subspecialized, final interpretations. This level of performance can be difficult to achieve, or impossible to afford, using only a local contracted group or hospital-employed radiologists.
A combined onsite/cloud solution can present unique advantages in the creation of an imaging service line. As an example, with teleradiology servicing the deephawk shift, local groups could – with the same level of resources – redeploy physicians and stagger start times, allowing them to have an onsite presence through the midhawk shift (or up until 12:00 a.m.) for when the emergency department is busiest and when most of the RVU value is available. The service line volume and value variations may also be optimized by moving studies laterally between hospitals to best use the available onsite imaging resources. These kinds of solutions require data and insight to show how best to construct an imaging service line to meet the needs of a specific health system – using their performance, as well as comparisons to peer institutions.
Indispensable insight
To create a health-system-wide imaging service line, all stakeholders must first define alignment and understand the “why” of the partnership – decreased costs, improved quality and documented high service levels that are consistently defined and delivered. Only then can they solve for the “how” to get from their current state to their common goals. It is a partnership to drive alignment for the benefit of the patients they collectively serve. Radiology has the opportunity to grab the “data mantle” and use analytics and insight to become an indispensable partner. The tools are now available; the desire to challenge the status quo and embrace change must follow.
Dr. Strong is CMO of vRad (www.vrad.com), a global telemedicine company and the nation’s largest radiology practice with over 450 physicians.
[i]Source: vRad clinical database analysis February, 2014; http://vrad.com/#/life-of-radiology.
At the Becker's 11th Annual IT + Revenue Cycle Conference: The Future of AI & Digital Health, taking place September 14–17 in Chicago, healthcare executives and digital leaders from across the country will come together to explore how AI, interoperability, cybersecurity, and revenue cycle innovation are transforming care delivery, strengthening financial performance, and driving the next era of digital health. Apply for complimentary registration now.