
The following is reprinted with permission from Singletrack Analytics.
One of the first decisions to be made by applicants to the Medicare bundled payment initiative will be the selection of DRGs for which they will participate. Many facts are involved in the selection, including the participation of physicians in the related specialties, the ability to create hospital cost savings, and the ability to reduce provider utilization that will bring Medicare costs within the bundled payment contacted amount. An additional factor playing into this decision relates to the amount of risk, and opportunity for reward, that the contacting organization is willing to assume.
Risk in DRGs
In bundled payment as in most other areas, risk is measured by the degree of variation occurring within the activity. An activity that always generates the same result contains no risk. As the variation in results increases, so does the risk of favorable or unfavorable results.
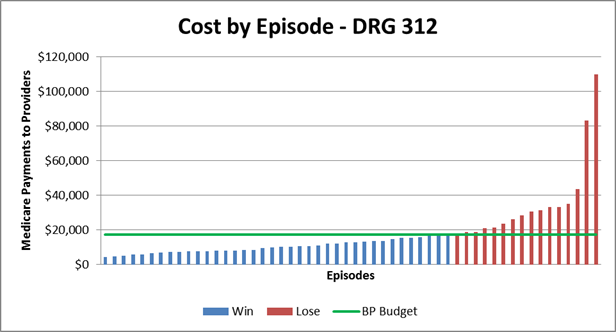
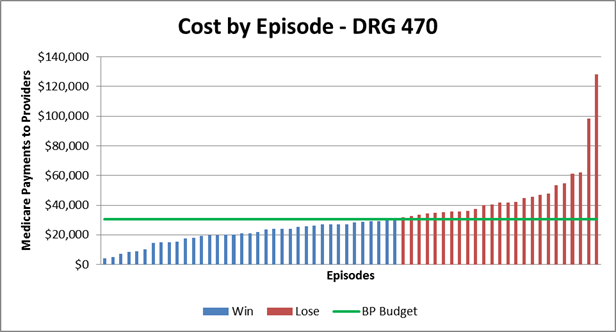
Under bundled payment, this risk is determined by the patient-to-patient variation in Medicare payments to providers (hereafter referred to as "cost") within the DRG. An example is this variation is shown below for a particular set of patients in DRGs 312 and 470. In this example, each patient episode is represented by a vertical bar. The bundled payment budget is shown by green line at 97 percent of the average payment, reflecting the 3 percent discount given to CMS. Blue bars represent cases in which the contacting organization will "win" because their costs were lower than the bundled payment budget. Conversely, the red bars represent cases in which costs exceed the bundled payment budget, for which the contacting organization would need to repay CMS. Note: This repayment would occur in aggregate across all DRGs and episodes, not for individual episodes. The difference between the green line and the tops of the vertical bars represents the risk inherent in this DRG.
Two DRGs are shown in the examples below, along with the coefficient of variation of each, which will be discussed in further detail later in this article.
• DRG 312 – Syncope & collapse. Coefficient of variation = 1.7
• DRG 470 – Major joint replacement or reattachment of lower extremity w/c MCC (major complications and co-morbidities). Coefficient of variation = .53
The graph below places both DRGs on the same axes, allowing an easier comparison of the distribution curves. DRG 312 had fewer cases than DRG 470, which accounts for the shorter curve.
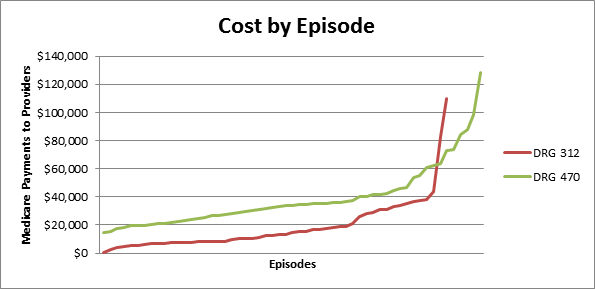
In the first two bar charts above, the opportunity for savings occurs in reducing the height of the red bars down to the level of the green line. To the extent that this is possible, the contacting organization will benefit financially. However, DRGs having a large amount of inherent variation may contain costs that cannot be eliminated; thereby their existence places the organization at financial risk. Thus, variation is a measure of both risk and opportunity. In DRG 470 the two highest patients' cost is 3 to 4 times the average cost, while for DRG 312 the two highest-cost patients are 5 to 6 times the average cost. Therefore, reducing the cost of these outlier patients would create a greater cost savings in DRG 312 than in DRG 470.
Risk differences among DRG groups
A common measure of the amount of variation in results is the "coefficient of variation," which is the standard deviation divided by the mean. This provides a metric that can be used to compare the amount of risk of various types of activities. The "CV" amounts shown for the two DRGs above represent the coefficients of variation for those DRGs.
Previous bundled payment demonstrations include certain specific surgical DRGs. However, the MBPI allows inclusion of medical DRGs. It also requires inclusion of costs incurred from the post-discharge period of between 30 and 90 days. Both of these characteristics affect the amount of risk assumption borne by the contacting organization.
In the selection of DRGs, medical cases have higher coefficients of variation. This is logical considering the Medicare payment methodology for these cases. For most surgical cases, physicians are paid a fixed fee, similar to the DRG payment made hospitals; therefore, physician cost would have low variability in these cases. (There would, of course be variation in post-discharge cost for these DRGs.) From medical cases, however, physicians are generally paid on a per hospital visit basis, which means that their fees would vary depending on the length of stay of the patient. This would create a higher variability in their fees.
The graph below shows the coefficients of variation of the 50 highest-cost DRGs in a large sample of patients. Each bar represents a different DRG; the red bars represent medical DRGs, while the blue bars represent surgical DRGs. Note that the red bars are clustered for the higher end of the scale, while the blue bars are clustered near the low end. This corroborates the fact that surgical DRGs general contain less inherent risk, but also percent less opportunity for cost savings, simply because there is less variation to reduce.
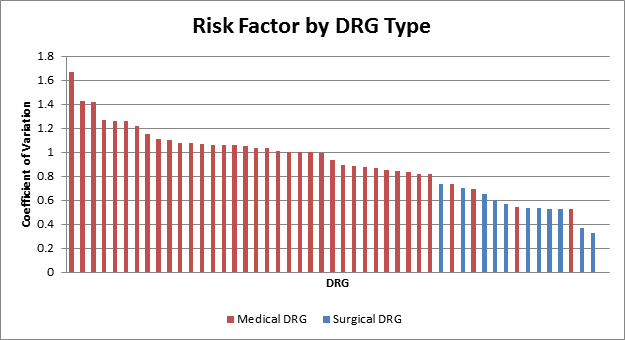
This risk behavior must be considered in evaluating DRGs to be selected for bundled payment. Contacting organizations having high adversity to risk may prefer selecting surgical DRGs over medical DRGs (other factors being equal) in order to minimize their risk of financial loss. Conversely, more aggressive organizations may prefer selecting medical DRGs because of a greater opportunity to reduce variations in costs.
Selection of Post-discharge Period
Another significant factor in bundled payment risk assumption is the selection of the post-discharge period to be included in the payment episode. In previous Medicare bundled payment demonstrations the episode ended at discharge, but in the MBPI the episode must include a minimum of 30 days post-discharge, and optionally can extend to 90 days or longer. This period creates additional variation in costs, and consequently creates higher risk. CMS recognizes this additional risk and allows contracting organizations that propose a 90 day or longer post-discharge episode to propose a 2 percent discount from the historical cost, as opposed to organizations selecting a shorter post-discharge period that must propose a minimum of 3 percent discount.
The variation in costs between the two episode lengths is shown in the chart below for DRG 470. These costs include only the post-discharge components (not the inpatient stay), with the blue bars indicating costs within the 30 day period and the red bars indicating the costs incurred within the following 60 days.
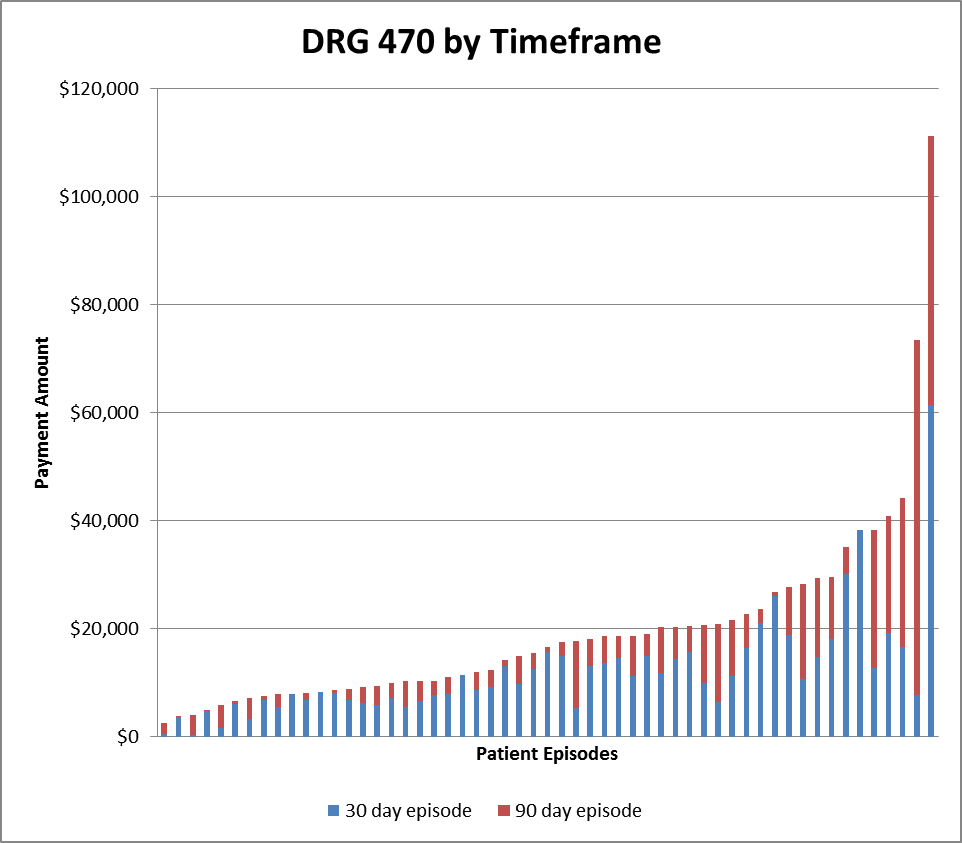
The average and standard deviations of the costs, and the coefficients of variation for these episodes are shown below. Note that the additional 60 days included in the 90-day episode had a higher coefficient of variation than the 30 day episode; therefore inclusion of that 60-day period increases the cost risk of the episode.
Bundled payment vs. ACO Risk
While inclusion of medical DRGs increases the risk of bundled payment participation, those risks are significantly lower than participation in an accountable care organization. In an ACO, the organization of responsible for the healthcare costs of all Medicare beneficiaries who are attributed to the ACOs’ primary care physicians. The health status of any of these beneficiaries may not be well known to the physicians, which makes it difficult to understand and manage those conditions. By contrast, bundled payment patients are hospital inpatients, or have recently completed an inpatient stay, and probably have up-to-date diagnostic information available, and their conditions are well known to their physicians. These patients should be easier to manage.
In addition, the variation in costs among Medicare beneficiaries is significantly higher than those found within the DRG categories used in bundled payment. While the coefficients of variation of the above DRGs range from 0.4 to 1.6, the coefficient of variation of total cost per beneficiary from the same population was 2.7. This indicates a significantly higher level of risk, and potentially of opportunity, for these patients; however the difficulty in maintaining information about the patient health status may make it difficult to identify and reduce the instances of high cost in this population.
Post-Discharge Services Create New Challenges for Medicare Bundled Payment Participants
One of the first decisions to be made by applicants to the Medicare bundled payment initiative will be the selection of DRGs for which they will participate. Many facts are involved in the selection, including the participation of physicians in the related specialties, the ability to create hospital cost savings, and the ability to reduce provider utilization that will bring Medicare costs within the bundled payment contacted amount. An additional factor playing into this decision relates to the amount of risk, and opportunity for reward, that the contacting organization is willing to assume.
Risk in DRGs
In bundled payment as in most other areas, risk is measured by the degree of variation occurring within the activity. An activity that always generates the same result contains no risk. As the variation in results increases, so does the risk of favorable or unfavorable results.
Under bundled payment, this risk is determined by the patient-to-patient variation in Medicare payments to providers (hereafter referred to as "cost") within the DRG. An example is this variation is shown below for a particular set of patients in DRGs 312 and 470. In this example, each patient episode is represented by a vertical bar. The bundled payment budget is shown by green line at 97 percent of the average payment, reflecting the 3 percent discount given to CMS. Blue bars represent cases in which the contacting organization will "win" because their costs were lower than the bundled payment budget. Conversely, the red bars represent cases in which costs exceed the bundled payment budget, for which the contacting organization would need to repay CMS. Note: This repayment would occur in aggregate across all DRGs and episodes, not for individual episodes. The difference between the green line and the tops of the vertical bars represents the risk inherent in this DRG.
Two DRGs are shown in the examples below, along with the coefficient of variation of each, which will be discussed in further detail later in this article.
• DRG 312 – Syncope & collapse. Coefficient of variation = 1.7
• DRG 470 – Major joint replacement or reattachment of lower extremity w/c MCC (major complications and co-morbidities). Coefficient of variation = .53
The graph below places both DRGs on the same axes, allowing an easier comparison of the distribution curves. DRG 312 had fewer cases than DRG 470, which accounts for the shorter curve.
In the first two bar charts above, the opportunity for savings occurs in reducing the height of the red bars down to the level of the green line. To the extent that this is possible, the contacting organization will benefit financially. However, DRGs having a large amount of inherent variation may contain costs that cannot be eliminated; thereby their existence places the organization at financial risk. Thus, variation is a measure of both risk and opportunity. In DRG 470 the two highest patients' cost is 3 to 4 times the average cost, while for DRG 312 the two highest-cost patients are 5 to 6 times the average cost. Therefore, reducing the cost of these outlier patients would create a greater cost savings in DRG 312 than in DRG 470.
Risk differences among DRG groups
A common measure of the amount of variation in results is the "coefficient of variation," which is the standard deviation divided by the mean. This provides a metric that can be used to compare the amount of risk of various types of activities. The "CV" amounts shown for the two DRGs above represent the coefficients of variation for those DRGs.
Previous bundled payment demonstrations include certain specific surgical DRGs. However, the MBPI allows inclusion of medical DRGs. It also requires inclusion of costs incurred from the post-discharge period of between 30 and 90 days. Both of these characteristics affect the amount of risk assumption borne by the contacting organization.
In the selection of DRGs, medical cases have higher coefficients of variation. This is logical considering the Medicare payment methodology for these cases. For most surgical cases, physicians are paid a fixed fee, similar to the DRG payment made hospitals; therefore, physician cost would have low variability in these cases. (There would, of course be variation in post-discharge cost for these DRGs.) From medical cases, however, physicians are generally paid on a per hospital visit basis, which means that their fees would vary depending on the length of stay of the patient. This would create a higher variability in their fees.
The graph below shows the coefficients of variation of the 50 highest-cost DRGs in a large sample of patients. Each bar represents a different DRG; the red bars represent medical DRGs, while the blue bars represent surgical DRGs. Note that the red bars are clustered for the higher end of the scale, while the blue bars are clustered near the low end. This corroborates the fact that surgical DRGs general contain less inherent risk, but also percent less opportunity for cost savings, simply because there is less variation to reduce.
This risk behavior must be considered in evaluating DRGs to be selected for bundled payment. Contacting organizations having high adversity to risk may prefer selecting surgical DRGs over medical DRGs (other factors being equal) in order to minimize their risk of financial loss. Conversely, more aggressive organizations may prefer selecting medical DRGs because of a greater opportunity to reduce variations in costs.
Selection of Post-discharge Period
Another significant factor in bundled payment risk assumption is the selection of the post-discharge period to be included in the payment episode. In previous Medicare bundled payment demonstrations the episode ended at discharge, but in the MBPI the episode must include a minimum of 30 days post-discharge, and optionally can extend to 90 days or longer. This period creates additional variation in costs, and consequently creates higher risk. CMS recognizes this additional risk and allows contracting organizations that propose a 90 day or longer post-discharge episode to propose a 2 percent discount from the historical cost, as opposed to organizations selecting a shorter post-discharge period that must propose a minimum of 3 percent discount.
The variation in costs between the two episode lengths is shown in the chart below for DRG 470. These costs include only the post-discharge components (not the inpatient stay), with the blue bars indicating costs within the 30 day period and the red bars indicating the costs incurred within the following 60 days.
The average and standard deviations of the costs, and the coefficients of variation for these episodes are shown below. Note that the additional 60 days included in the 90-day episode had a higher coefficient of variation than the 30 day episode; therefore inclusion of that 60-day period increases the cost risk of the episode.
| 30 Day Episode | 90 Day Episode | |
| Avg | $12,155 | $8,126 |
| Std Dev |
$9,625 |
$11,847 |
| CV |
0.79 | 1.46 |
Bundled payment vs. ACO Risk
While inclusion of medical DRGs increases the risk of bundled payment participation, those risks are significantly lower than participation in an accountable care organization. In an ACO, the organization of responsible for the healthcare costs of all Medicare beneficiaries who are attributed to the ACOs’ primary care physicians. The health status of any of these beneficiaries may not be well known to the physicians, which makes it difficult to understand and manage those conditions. By contrast, bundled payment patients are hospital inpatients, or have recently completed an inpatient stay, and probably have up-to-date diagnostic information available, and their conditions are well known to their physicians. These patients should be easier to manage.
In addition, the variation in costs among Medicare beneficiaries is significantly higher than those found within the DRG categories used in bundled payment. While the coefficients of variation of the above DRGs range from 0.4 to 1.6, the coefficient of variation of total cost per beneficiary from the same population was 2.7. This indicates a significantly higher level of risk, and potentially of opportunity, for these patients; however the difficulty in maintaining information about the patient health status may make it difficult to identify and reduce the instances of high cost in this population.
Related Articles by Singletrack Analytics:
Financial Advantages Under ACO Model Only Possible With Reduced Payments to Providers?Post-Discharge Services Create New Challenges for Medicare Bundled Payment Participants