
In the Bundled Payments for Care Improvement initiative, an important decision involves selecting the length of the episode. According to the CMS application guidelines, organizations choosing a minimum 30 day episode must propose a discount equal to at least 3 percent of the historical cost of the episode, while organizations proposing a minimum 90 day episode may propose a minimum 2 percent discount. There are several factors to be considered in selection of episode length, including the effective discount when hospitals are the major risk-assuming entity, the potential financial advantage of selecting a longer episode and the evaluation of risks in selecting the longer episode length.
The amount of the effective discount is based on the proportion of hospital costs to total episode costs. For example, if the episode only included hospital cost, a 3 percent discount of the episode costs would result of the 3 percent discount of the hospital's cost. However, if the hospital cost accounted for 50 percent of the episode costs, the effective discount rate of the hospital's cost would be 6 percent.
This percentage varies significantly among different DRGs. In one set of data that we studied, hospital cost accounted for 47 percent of the 90 day episode costs for DRG 470 (Major joint replacement), but only 27 percent of the 90 day episode cost for DRG 65 (Intracranial hemorrhage). Therefore the effective hospital discount for DRG 470 would be 6.1 percent, while for DRG 65 it would be 11.1 percent. Among the most common DRGs, effective discounts ranged from 3.8 percent to 5.4 percent depending on the DRG. An example of this calculation is below.
This percentage will also vary depending on the episode length selected (30 or 90 days post-discharge) since the hospital percentage of the total cost will vary across those episodes. Generally the 30-day lengths will have a larger proportion of hospital cost, simply because the inpatient admission occurs during that period. Therefore, the effective discount to the hospital increases if the longer episode length is selected because the total episode cost increases disproportionately to the hospital portion of the episode cost. This is shown in the following example:
This example shows total payments for a selected DRG. The increase in hospital payments from the 30 to 90 day episode generally represents readmissions, which may or may not occur at the contracting hospital. Therefore, the increase in effective discount for the longer period may be understated by this example.
As the proportion of costs attributable to the later part of the episode increases, the dollar amount of the discount also increases. The proportion of cost occurring in the latter part of the episode is often sufficiently low as to make the 90 day episode selection the lower cost alternative, as shown in the example above. In the same set of data, DRG 470 had 9 percent of its cost in the later period, so the total cost of the discount was 36 percent lower for the 90 day period than for the 30 day period. However, for DRG 392 (Esophagitis) 36 percent of the cost was in the later period, which caused the total discount for the 90 day period to be 3 percent higher than that for the 30 day period. This relationship is linear and is shown in the graph below.
In this graph, a low percentage (8 percent) of cost occurring in the 31-to-90 day period results in a discount amount that is 38 percent lower than the 3 percent discount would be for the 30 day period for that same DRG. However, as a percentage of costs in the later period increases, the attractiveness of the 90 day period decreases, and disappears when 1/3 cost occurs during that period.
Breaking even
Basically, when selecting the 90 day episode you're betting that the costs during the BPCI of the additional 60 days won't exceed their historical costs by more than the discount that you're saving by selecting that period. If the total discount to be saved is $60,000 and there are 400 episodes, you’re saving $150 per episode by selecting the longer episode length with the lower discount. But you're also betting that the costs during that 31-90 day period won't increase by more than an average of $150 per episode. If they do, you’ll have lost the discount amount, and perhaps more.
All other factors being equal (hopefully all other factors will not be equal, since you should have some plan in place to reduce costs in this period), there's a 50 percent chance that ongoing costs will be equal or lower than the historical average. But what's the probability that they'll be higher than the historical average cost plus the discount savings, which is your break-even point? To estimate this we need to perform some statistical analysis on the 31-90 day costs.
Those costs aren't normally distributed, but the averages of samples of those costs will be approximately normally distributed according to the central limit theorem. When we create those samples, compute their means and standard deviations and apply those amounts to a normal distribution function along with breakeven cost, we can compute the probability that the average cost during the BPCI will exceed the breakeven cost.
In looking at a group of high-volume DRGs, we found that this probability rarely exceeded 53 percent, which means that it's almost even odds that costs will exceed the breakeven amount. This is because the amount of the additional discount is small relative to the amount of variation in the 31-90 day episode costs. Therefore, this analysis isn't particularly helpful.
Additional risks
The other factor to consider, though, is the additional risk that you're assuming by taking on the additional 31-90 day portion of the episode. There's a 50 percent chance that costs will be lower than the historical average, but also a 50 percent chance that they’ll be higher. But how much higher, and with what probability?
This depends on two factors: the percentage of total episode cost occurring in the 31-90 day period and the amount of variation in that cost. For DRGs such as 470 (major joint replacement), less than 10 percent of the episode cost occurs in the 31-90 day period, so even major variations in that cost would have a small effect on the total episode cost. But medical DRGs like DRG 313 (chest pain) may have more than 30 percent of their cost in this period, so a variation in those costs can significantly affect the overall episode costs. Also, the amount of variation in that cost is lower for DRG 470 (having a coefficient of variation of 75 percent) than for DRG 313 which has a coefficient of about 120 percent. This means that both of the contributing factors (percentage of total episode cost and amount of variation) are higher for DRG 313 than for DRG 470. This means that DRG 313 clearly has more risk than DRG 470.
But how much more risk? To estimate this we computed the probabilities of different levels of 31-90 day episode costs according to their cost distributions and then added those costs to the remainder of the episode (e.g., those from the inpatient and 1-30 days post-discharge periods) cost to compute the change in total episode cost. Examples of those computations are shown in the two graphs below.
On each graph the horizontal (X) axis shows the percent change in 31-90 day episode cost, from decreasing to zero (a change of -100 percent) to more than doubling (a change of 150 percent). The blue line shows the effect of that change on total episode cost. This is a function of the percentage of episode cost occurring in the 31-90 day period. DRGs such as 470 that have a smaller percentage of cost occurring in that period have a flatter line than DRGs having proportionally more cost in that period.
The red line shows the probability that the costs will be equal or lower than the corresponding amount on the X axis, and also the amount shown on the blue line. This is a function of the amount of variation in the costs during the 31-90 day period. The red and blue lines cross at the point where the red line represents 50 percent probability and the blue line represents 100 percent of the historical costs, as they should.
Looking at the graph for DRG 470, we first see that the blue line runs from 90 percent to 110 percent of total episode costs. This is a relatively narrow range of variation. Also note that the red line runs from near zero to near 100 percent, indicating that there's a very small possibility that total episode costs would exceed about 110 percent of historical costs because of fluctuation in the 31-90 day costs. Selecting any other point on these lines will give the probability (from the red line) that total costs will be less than or equal to the corresponding amount indicated by the blue line. For example, finding the point along the blue line corresponding to 105 percent (indicated by the green bar) shows a probability of about 80 percent that total costs will be equal or lower than that amount.
The chart for DRG 313 is significantly different from DRG 470. Note that the blue line extends from about 62 percent to about 155 percent. This is a significant amount of variation and is caused by the large proportion of episode costs occurring in the 31-90 day period. Also note that the red line has a maximum value of only about 90 percent, indicating that there’s a 10 percent probability that total episode costs could exceed 155 percent percent of the historical average because of variations in the 31-90 day costs.
Obviously this difference in potential risk is significant. If a CO is willing to accept a 20 percent risk of loss, in DRG 470 it would result in a loss of about 7 percent of the total episode cost. The same risk of loss would result in a loss of almost 50 percent of total episode cost for DRG 313. The former may be acceptable; the latter would probably be unacceptable. Of course, the risk runs in both directions — there's an equal probability of a significant decrease in cost occurring — but the magnitude of the potential loss generally is of greater concern than the opportunity of a similar amount of gain.
Why are we concerned with variation in these costs? Because we're "buying" that variation by selecting the 90-day episode to obtain the lower discount rate. Incurring this risk is optional — it's not a requirement of participation in the BPCI initiative. Therefore, consideration of the additional risk assumed by including this part of the episode should be part of the overall BPCI decision process. For DRGs such as DRG 470 in which the proportion of 31-90 day cost is low, selecting the longer episode may result in a savings in the discount amount while assuming relatively little additional risk. However, many medical DRGs have significant portions of cost in the 31-90 day period, which may limit the discount advantage while creating significantly more risk.
Hopefully this analysis won't be relevant to many BPCI participants, because it assumes that variations in these costs are random. But the objective of the BPCI is to control these costs and reduce their variation downward through effective patient management. While randomness will still occur, planners should also factor the effect of these initiatives into the risk analysis.
Note: Some of the sample sizes available in the data used in this analysis may be too small to qualify for rigorous statistical validity. The goal here was not to present statistically valid results for this particular set of data, but instead to describe the variations in various cost elements that will affect the risks in accepting the longer episode length and present a methodology for analyzing them.
Jon Pearce is the founding principal of Singletrack Analytics, a healthcare consulting firm focused on healthcare data and financial analysis. He has more than 30 years of experience working with healthcare finance, clinical and operational teams. Recently he has worked with more than a dozen healthcare provider groups in analyzing Medicare bundled payment data and structuring proposals under this initiative. Mr. Pearce will be presenting “Leveraging Lessons Learned from Bundled Payment Analytics” with Gloria Kupferman (GKupferm@hanys.org) from DataGen at the Bundled Payment Summit in Washington DC on June 13.
ACO Final Rule Modifies Risk Adjustment, But Concerns Remain
Effective hospital discount
As mentioned above, BPCI contracting organizations (COs) are required to propose a minimum discount percentage of the total historical average cost (i.e., payments by CMS and beneficiaries to providers), based on the episode length. If COs could spread the cost of this discount across all providers, the discount to each provider would be identical to the overall discount (e.g., 2 percent or 3 percent). In reality, however, hospitals may end up assuming this entire discount because the other providers in the episode can't be required to share in it. Therefore, the effective discount to the hospital will be greater than the CMS discount amount.The amount of the effective discount is based on the proportion of hospital costs to total episode costs. For example, if the episode only included hospital cost, a 3 percent discount of the episode costs would result of the 3 percent discount of the hospital's cost. However, if the hospital cost accounted for 50 percent of the episode costs, the effective discount rate of the hospital's cost would be 6 percent.
This percentage varies significantly among different DRGs. In one set of data that we studied, hospital cost accounted for 47 percent of the 90 day episode costs for DRG 470 (Major joint replacement), but only 27 percent of the 90 day episode cost for DRG 65 (Intracranial hemorrhage). Therefore the effective hospital discount for DRG 470 would be 6.1 percent, while for DRG 65 it would be 11.1 percent. Among the most common DRGs, effective discounts ranged from 3.8 percent to 5.4 percent depending on the DRG. An example of this calculation is below.
| Total discount (3%/30) |
Hospital portion of episode cost |
Discount % of hospital cost | |
| Heart failure | $38,927 | $461,923 |
8.4% |
| Joint replacement | $190,084 | $2,934,124 | 6.5% |
This percentage will also vary depending on the episode length selected (30 or 90 days post-discharge) since the hospital percentage of the total cost will vary across those episodes. Generally the 30-day lengths will have a larger proportion of hospital cost, simply because the inpatient admission occurs during that period. Therefore, the effective discount to the hospital increases if the longer episode length is selected because the total episode cost increases disproportionately to the hospital portion of the episode cost. This is shown in the following example:
| Hospital payment |
Total payment |
Ratio | |
| 30 day |
$ 800,303 | $ 1,141,656 | 70% |
| 90 day |
$ 1,153,602 |
$ 1,796,699 | 64% |
This example shows total payments for a selected DRG. The increase in hospital payments from the 30 to 90 day episode generally represents readmissions, which may or may not occur at the contracting hospital. Therefore, the increase in effective discount for the longer period may be understated by this example.
Discounts for different episode periods
The percentage of cost occurring between the 31st and 90th day of the episode affects the total dollar amount of discount given. The lower the percentage of this cost, the lower the total dollar amount of discount. For example, in a DRG having no costs in this period, a 2 percent discount of the entire episode cost would obviously result in a lower total dollar amount than a 3 percent discount of the same amount. An example of this calculation is shown below.| Period | Cost | Discount % | Discount |
| 30 day |
$ 5,617,989 |
3% |
$ 168,540 |
| 90 day |
$ 6,206,065 | 2% |
$ 124,121 |
| Difference | $ 44,418 |
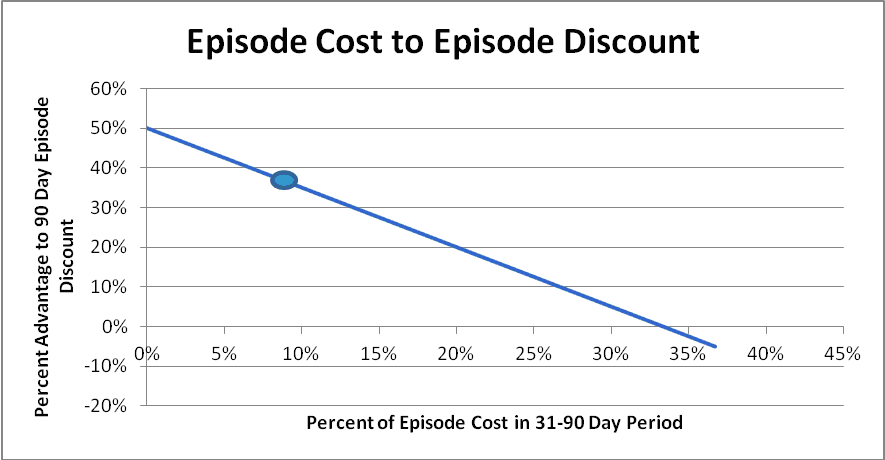
As the proportion of costs attributable to the later part of the episode increases, the dollar amount of the discount also increases. The proportion of cost occurring in the latter part of the episode is often sufficiently low as to make the 90 day episode selection the lower cost alternative, as shown in the example above. In the same set of data, DRG 470 had 9 percent of its cost in the later period, so the total cost of the discount was 36 percent lower for the 90 day period than for the 30 day period. However, for DRG 392 (Esophagitis) 36 percent of the cost was in the later period, which caused the total discount for the 90 day period to be 3 percent higher than that for the 30 day period. This relationship is linear and is shown in the graph below.
In this graph, a low percentage (8 percent) of cost occurring in the 31-to-90 day period results in a discount amount that is 38 percent lower than the 3 percent discount would be for the 30 day period for that same DRG. However, as a percentage of costs in the later period increases, the attractiveness of the 90 day period decreases, and disappears when 1/3 cost occurs during that period.
Risk considerations
A final consideration in the period length selection is the amount of additional risk assumed by the contacting organization for the variation in costs that occurs during the 31 to 90 day period. This involves some sophisticated statistical analysis, but we'll save you the trouble of digging into it because the results are pretty consistent and unimpressive.Breaking even
Basically, when selecting the 90 day episode you're betting that the costs during the BPCI of the additional 60 days won't exceed their historical costs by more than the discount that you're saving by selecting that period. If the total discount to be saved is $60,000 and there are 400 episodes, you’re saving $150 per episode by selecting the longer episode length with the lower discount. But you're also betting that the costs during that 31-90 day period won't increase by more than an average of $150 per episode. If they do, you’ll have lost the discount amount, and perhaps more.
All other factors being equal (hopefully all other factors will not be equal, since you should have some plan in place to reduce costs in this period), there's a 50 percent chance that ongoing costs will be equal or lower than the historical average. But what's the probability that they'll be higher than the historical average cost plus the discount savings, which is your break-even point? To estimate this we need to perform some statistical analysis on the 31-90 day costs.
Those costs aren't normally distributed, but the averages of samples of those costs will be approximately normally distributed according to the central limit theorem. When we create those samples, compute their means and standard deviations and apply those amounts to a normal distribution function along with breakeven cost, we can compute the probability that the average cost during the BPCI will exceed the breakeven cost.
In looking at a group of high-volume DRGs, we found that this probability rarely exceeded 53 percent, which means that it's almost even odds that costs will exceed the breakeven amount. This is because the amount of the additional discount is small relative to the amount of variation in the 31-90 day episode costs. Therefore, this analysis isn't particularly helpful.
Additional risks
The other factor to consider, though, is the additional risk that you're assuming by taking on the additional 31-90 day portion of the episode. There's a 50 percent chance that costs will be lower than the historical average, but also a 50 percent chance that they’ll be higher. But how much higher, and with what probability?
This depends on two factors: the percentage of total episode cost occurring in the 31-90 day period and the amount of variation in that cost. For DRGs such as 470 (major joint replacement), less than 10 percent of the episode cost occurs in the 31-90 day period, so even major variations in that cost would have a small effect on the total episode cost. But medical DRGs like DRG 313 (chest pain) may have more than 30 percent of their cost in this period, so a variation in those costs can significantly affect the overall episode costs. Also, the amount of variation in that cost is lower for DRG 470 (having a coefficient of variation of 75 percent) than for DRG 313 which has a coefficient of about 120 percent. This means that both of the contributing factors (percentage of total episode cost and amount of variation) are higher for DRG 313 than for DRG 470. This means that DRG 313 clearly has more risk than DRG 470.
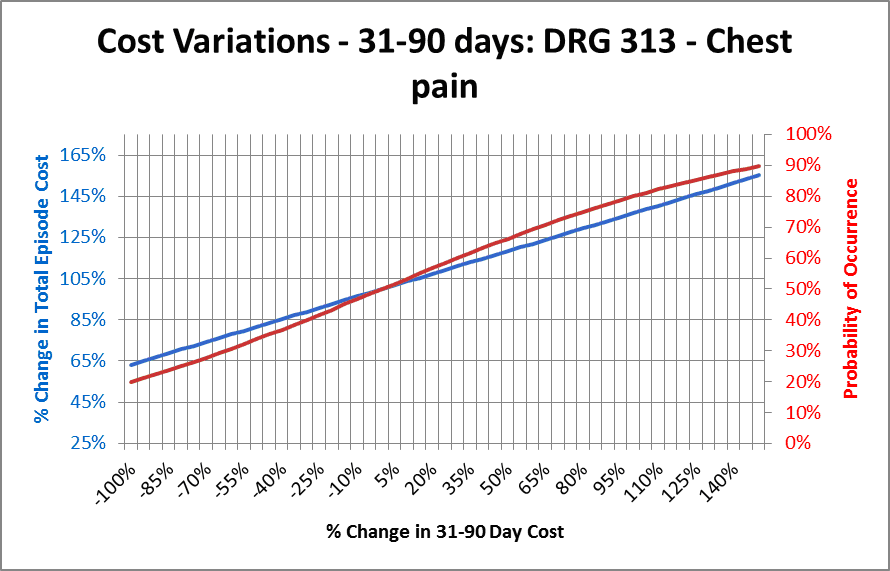
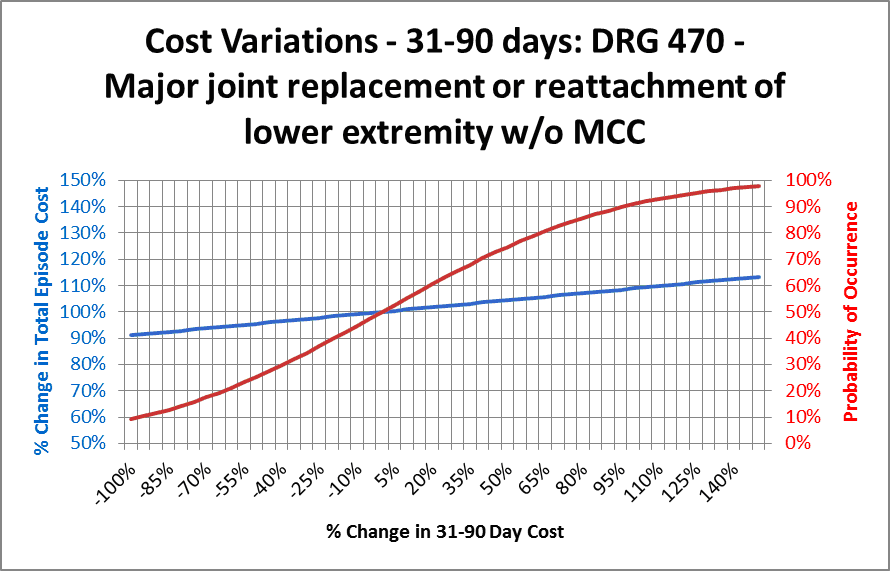
But how much more risk? To estimate this we computed the probabilities of different levels of 31-90 day episode costs according to their cost distributions and then added those costs to the remainder of the episode (e.g., those from the inpatient and 1-30 days post-discharge periods) cost to compute the change in total episode cost. Examples of those computations are shown in the two graphs below.
On each graph the horizontal (X) axis shows the percent change in 31-90 day episode cost, from decreasing to zero (a change of -100 percent) to more than doubling (a change of 150 percent). The blue line shows the effect of that change on total episode cost. This is a function of the percentage of episode cost occurring in the 31-90 day period. DRGs such as 470 that have a smaller percentage of cost occurring in that period have a flatter line than DRGs having proportionally more cost in that period.
The red line shows the probability that the costs will be equal or lower than the corresponding amount on the X axis, and also the amount shown on the blue line. This is a function of the amount of variation in the costs during the 31-90 day period. The red and blue lines cross at the point where the red line represents 50 percent probability and the blue line represents 100 percent of the historical costs, as they should.
Looking at the graph for DRG 470, we first see that the blue line runs from 90 percent to 110 percent of total episode costs. This is a relatively narrow range of variation. Also note that the red line runs from near zero to near 100 percent, indicating that there's a very small possibility that total episode costs would exceed about 110 percent of historical costs because of fluctuation in the 31-90 day costs. Selecting any other point on these lines will give the probability (from the red line) that total costs will be less than or equal to the corresponding amount indicated by the blue line. For example, finding the point along the blue line corresponding to 105 percent (indicated by the green bar) shows a probability of about 80 percent that total costs will be equal or lower than that amount.
The chart for DRG 313 is significantly different from DRG 470. Note that the blue line extends from about 62 percent to about 155 percent. This is a significant amount of variation and is caused by the large proportion of episode costs occurring in the 31-90 day period. Also note that the red line has a maximum value of only about 90 percent, indicating that there’s a 10 percent probability that total episode costs could exceed 155 percent percent of the historical average because of variations in the 31-90 day costs.
Obviously this difference in potential risk is significant. If a CO is willing to accept a 20 percent risk of loss, in DRG 470 it would result in a loss of about 7 percent of the total episode cost. The same risk of loss would result in a loss of almost 50 percent of total episode cost for DRG 313. The former may be acceptable; the latter would probably be unacceptable. Of course, the risk runs in both directions — there's an equal probability of a significant decrease in cost occurring — but the magnitude of the potential loss generally is of greater concern than the opportunity of a similar amount of gain.
Why are we concerned with variation in these costs? Because we're "buying" that variation by selecting the 90-day episode to obtain the lower discount rate. Incurring this risk is optional — it's not a requirement of participation in the BPCI initiative. Therefore, consideration of the additional risk assumed by including this part of the episode should be part of the overall BPCI decision process. For DRGs such as DRG 470 in which the proportion of 31-90 day cost is low, selecting the longer episode may result in a savings in the discount amount while assuming relatively little additional risk. However, many medical DRGs have significant portions of cost in the 31-90 day period, which may limit the discount advantage while creating significantly more risk.
Hopefully this analysis won't be relevant to many BPCI participants, because it assumes that variations in these costs are random. But the objective of the BPCI is to control these costs and reduce their variation downward through effective patient management. While randomness will still occur, planners should also factor the effect of these initiatives into the risk analysis.
Note: Some of the sample sizes available in the data used in this analysis may be too small to qualify for rigorous statistical validity. The goal here was not to present statistically valid results for this particular set of data, but instead to describe the variations in various cost elements that will affect the risks in accepting the longer episode length and present a methodology for analyzing them.
Jon Pearce is the founding principal of Singletrack Analytics, a healthcare consulting firm focused on healthcare data and financial analysis. He has more than 30 years of experience working with healthcare finance, clinical and operational teams. Recently he has worked with more than a dozen healthcare provider groups in analyzing Medicare bundled payment data and structuring proposals under this initiative. Mr. Pearce will be presenting “Leveraging Lessons Learned from Bundled Payment Analytics” with Gloria Kupferman (GKupferm@hanys.org) from DataGen at the Bundled Payment Summit in Washington DC on June 13.
More Articles By Jon Pearce:
Risk Assumption in the Medicare Bundled Payment InitiativeACO Final Rule Modifies Risk Adjustment, But Concerns Remain