
Establish actuarial cost and utilization targets appropriate for the:
- ACO’s designated business
- Provide medical management to achieve those targets
Whether an ACO enters into a shared savings or capitation arrangement, its financial success will depend on delivering and managing care that meets or beats the established actuarial budget. For ACO arrangements, the overall financial budget will be established by the payor or regulator (CMS, local health plan, state Medicaid plan, etc.). But the ACO will need to convert these budgets into utilization targets and validate the reasonability of the targets by performing its own actuarial analysis and projection. Unless the providers in the ACOs have the appetite to implement possibly steep unit cost and income reductions, utilization reduction and improved efficiency will likely determine whether an ACO achieves the established targets. [1]
Benchmark, Prioritize, and PrePare
An ACO will need to take the following steps to evaluate the feasibility of the financial budget established by the payor/regulator:
- Use the designated population’s historical data to build an actuarial cost and utilization model consistent with the base period that CMS (or other payor) will use to evaluate performance
- Compare the historical data to actuarial benchmarks, appropriately adjusted for demographics and risk
- Categorize the utilization data by:
— Meaningful and impactable service categories
— Site of service where indicated (hospital outpatient versus − ambulatory surgical center, etc)
— ACO and non-ACO providers (leakage)
- Identify and prioritize potential opportunities for:
— Reducing utilization by service category
— Shifting utilization to alternative lower-cost sites of service
— Steering utilization to ACO providers
- Monetize those opportunities and calculate the overall financial impact
- Determine if the calculated financial impact will meet the terms required for financial success
The amount of utilization reduction, site of service shifting, and steerage to ACO providers that will be needed to meet or beat financial targets will depend on the current level of population management and the aggressiveness of the proposed financial budget. If the historical data shows a lot of “low-hanging” fruit (e.g., care provided to the population in the base period is loosely managed), it will take less work to meet targets. If the data shows little room for improvement, this should be taken into account when negotiating financial terms with payors, particularly if the required utilization targets are aggressive. In some cases, perhaps the deal should be avoided.
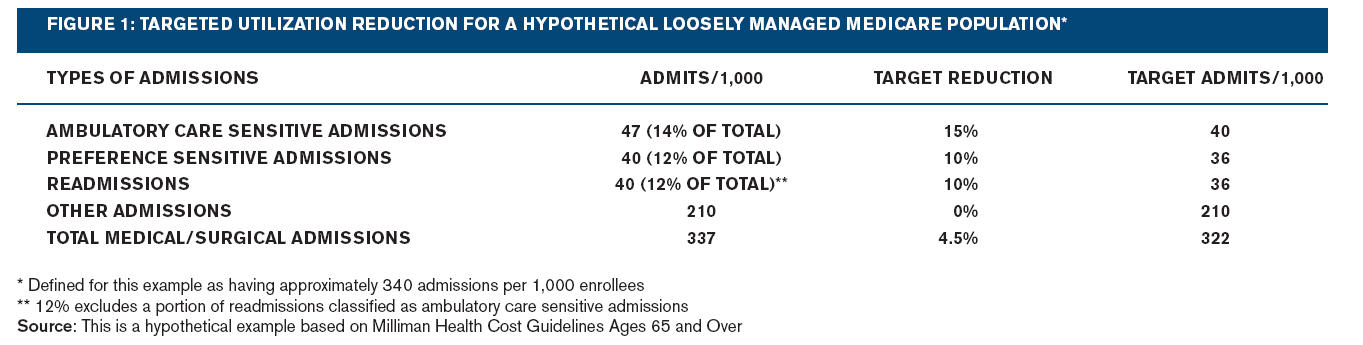
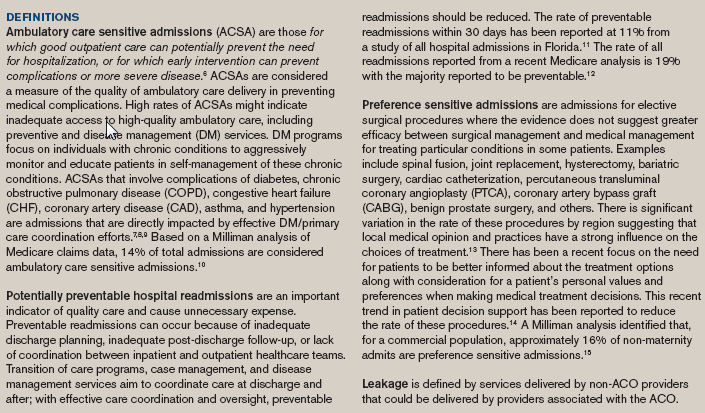
ACO’s should focus initial medical management efforts on reducing leakage to hospitals and specialists that are not part of the ACO. This will increase volume to ACO providers and help offset revenue loss due to improved utilization management. Inpatient utilization management is another target for initial medical management efforts particularly since inpatient costs make up approximately 30% [2] of total costs for a commercially insured population and 37% [3] of total Medicare Part A and B spend. Successful ACOs will focus medical management efforts both on avoiding potentially unnecessary admissions and on reducing inpatient hospital leakage (admissions to hospitals not associated with the ACO). Potential reductions in admission vary significantly by admission type, so identifying real opportunities requires analyzing historical data to identify impactable and non-impactable admissions. In particular, ambulatory care sensitive admissions, preference sensitive admissions, and readmissions are considered as impactable (see Definition sidebar). Claims data logic available from the Agency for Healthcare Research and Quality and published reports can help identify benchmark rates for these impactable admissions—and a sense of how many can actually be eliminated. Claims data queries can be constructed to identify the root cause of provider leakage by service category and by hospitals not associated with the ACO.
The ACO’s executive team will need to work closely with actuarial and clinical staff to determine reasonable reductions in leakage and overall utilization. For example, typical admission rates for impactable admissions for a loosely managed fee-for-service (FFS) Medicare population appear in the table in Figure 1. Assuming a 10%-15% reduction in these impactable admissions (a reduction of 15 admissions per 1,000) and an average unit cost paid across all admissions ($12,187), a 4.5% reduction in inpatient claim costs could be realized. This would equate to 1.7% of total claim dollars (4.5% of 37). In addition, costs associated with enhanced outpatient management (office visits, medication compliance, adherence to preventive care, etc.), and the related administrative expenses required to reduce these admissions, need to be netted from the projected cost reduction.
This illustration is from a payor’s perspective. The participating entities (in this case, the hospital) will need to evaluate the impact on its revenue and cost structure from reducing admissions. If the ACO can reduce leakage, it will increase admissions to the ACO hospital system, which could offset the loss from reducing impactable admissions.
While ACOs will need to focus initial management efforts on reducing leakage and avoiding unnecessary hospital admissions, continued success will require ACOs to undertake the difficult task of managing utilization of outpatient services which are roughly 70% of healthcare costs. Utilization of impactable outpatient services, including emergency room use, high-cost radiology procedures (MRI, CT, PET, etc.), and specialty visits, will need to be evaluated to identify medical management opportunities.
For comprehensive risk, an ACO will need a data warehouse and provider profiling system to easily produce up-to-date reports on utilization, cost, physician report cards and comparisons to targets. [4,5] Regular, accurate, and reliable analysis and reporting of results is critical for success. Performance must be constantly measured against targets to evaluate the effectiveness of the management efforts and allow for adjustments if necessary.
Manage to targets
Managing to these actuarial utilization targets is the biggest challenge. We are quickly reminded of the lessons learned from the physician health organization (PHO) failures of the early 1990s, when many provider-sponsored organizations failed to invest in the medical management programs critical for success. Without enough attention paid to managing utilization, these organizations failed in their efforts to improve care and achieve efficiencies. Without medical management services working the supply side and demand side, utilization will almost always exceed targets.
Supply-side medical management services are what many consider the more challenging side of medical management but they are also what produce the savings. These services are intended to reduce utilization and payment for medically unnecessary services and also ensure that care is delivered in the most appropriate setting, which for an ACO should mean delivered by an ACO-associated provider. Clinical guidelines help evaluate the medical necessity of requested (or, retrospectively, rendered) services. Supply-side services typically include:
- Referral management for specialist consults including managing consultation follow-up.
- Preauthorization for ambulatory and inpatient elective surgery, high-tech imaging, specialty drugs, home care, etc. Electronic medical records could allow services to be screened against best practice criteria in real time and reduce the formal preauthorization process that typically occurs.
- Inpatient concurrent review to facilitate efficient length of stay management and prevent medically unnecessary admissions
- Concurrent review of skilled nursing facility stays and home care services to manage appropriate utilization
- Primary care protocols for common clinic visits such as URIs, pharyngitis, pediatric otitis media, uncomplicated hypertension
- Extended clinic hours and phone triage to avoid emergency room utilization
ACOs need to consider where they can leverage current resources and expertise in their build/rent/buy decisions. Is the hospital’s case management department up to the job of diverting inappropriate admits in the emergency room, aggressively managing length of stay, and facilitating the most cost-effective discharge planning option to prevent readmissions? Are primary care physicians (PCPs) practicing in accordance with evidence-based practice guidelines, are they provided with tools to help them efficiently manage their patient panels, and do they have a specialty referral management system that is part of their routine workflow with incentives aligned to encourage managing specialty referrals?
Demand-side medical management services optimize a population’s health so that demand for services will be lower. In particular, these services can impact ambulatory care sensitive admissions, preference sensitive admissions, readmissions, and ER visits. Essential demand-side medical management operations include:
- PCP office-based telephone triage and advice, as well as e-visits and e-consults, to prevent unnecessary testing, specialty consults, office and emergency room visits
- Case management aimed at coordinating care and enhancing compliance with treatment plans
- Patient decision aid programs, including those targeting preference sensitive procedures (e.g., decision support systems to educate patient’s regarding alternatives to surgery)
- Transition of care programs to reduce readmissions
- Wellness and preventive services with proven value (e.g., smoking cessation, obesity management, and cancer screening)
- Disease registries and disease management for chronic conditions
Of course, providers must buy in to the need to manage to actuarial utilization targets. Aligning provider incentives to support an effective medical management infrastructure is key to the ACO’s financial and operational success.
Kate Fitch, RN, MEd, is a principal and healthcare consultant in the New York office of Milliman and is available at kate.fitch@milliman.com. Catherine Murphy-Barron, FSA, MAAA, is a principal and consulting actuary with the New York office of Milliman and is available at cathy.murphy-barron@milliman.com. David Mirkin, MD, is a principal and healthcare consultant in the New York office of Milliman and is available at david.mirkin@milliman.com.
Learn more about Milliman. View a pdf of this article.
-----------
1 Note that the Patient Protection and Affordable Care Act (PPACA) permits multiple legal structures for ACOs (group practices, networks, joint ventures, and integrated delivery systems). For simplicity, this paper presents the concepts assuming that the ACO is a single entity. A looser arrangement of multiple independent entities would require more detailed analysis, as each entitity would need to evaluate the arrangement, separately. For example, a joint venture of financially independent physician groups and hospitals would need internal financial and operational structures to ensure that each entity’s contribution is rewarded appropriately. Such analysis is beyond the scope of this paper, however.
2 2010 Milliman Medical Index. May 2010. Retrieved July, 23 2010, from http://insight.milliman.com/article.php?cntid=6897&utm_source=healthcare&utm_medium=web&utm_content=6897&utm_campaign=Health%20Feature
3 Per Milliman Health Cost Guidelines™ Ages 65 and Over.
4 Moyer, R. & Leonardo, P. (2010). Building an accountable care information system. Milliman Marketing Brief. Retrieved June 21, 2010, from http://www.milliman.com/expertise/healthcare/products-tools/medinsight/pdfs/building-an-accountable-care.pdf.
5 Parke, R. & Fitch, K. (Oct. 13, 2009). Accountable care organizations: The new provider model? Milliman Insight. Retrieved June 21, 2010, from http://insight.milliman.com/article.php?cntid=6056.
6 U.S. Department of Health and Human Services. Agency for Healthcare Research and Quality (AHRQ) (March 12, 2007). Guide to Prevention Quality Indicators, version 3.1. AHRQ Quality Indicators. Retrieved July 16, 2010, from http://www.qualityindicators.ahrq.gov/downloads/pqi/pqi_guide_v31.pdf.
7 Bindman, A.B., Chattopadhyay, A. & Auerback, G.M. (2008). Interruptions in Medicaid coverage and risk for hospitalization for ambulatory care–sensitive conditions. Annals of Internal Medicine149:854–60.
8 McCall, N. (June 2004). Investigation of increasing rates of hospitalization for ambulatory care sensitive admissions among Medicare fee for service beneficiaries. RTI International for CMS: project number 500-00-o029, task order 9.
9 Fisher, E.S., Goodman, D.C. & Chandra, A. (Dec. 1, 2008). Disparities in health and healthcare among Medicare beneficiaries” A brief report of the Dartmouth Atlas Project. Dartmouth Atlas Project Report commissioned for the Aligning Forces for Quality Program. Retrieved July 16, 2010, from http://www.dartmouthatlas.org/downloads/reports/AF4Q_Disparities_Report.pdf.
10 Fitch K. & Iwasaki, K. (January 2009). Ambulatory care sensitive admission rates: A key metric in evaluating health plan medical management effectiveness. Milliman Research Report. Retrieved July 16, 2010, from http://www.nybgh.org/pdfs/ambulatorycare.pdf.
11 Goldfield, N.I., McCullough, E.C., Hughes, I.S., et al. (2008). Identifying potentially preventable readmissions. Health Care Financing Review 30:75-91.
12 Jencks, S.F., Williams, M.V., & Coleman, E.A. (2009). Rehospitalizations among patients in the Medicare fee for service program. NEJM 360:1418-1428.
13 Center for the Evaluative Clinical Services (2007). Preference-sensitive care. Dartmouth Atlas Project Topic Brief. Retrieved July 16, 2010, from http://www.dartmouthatlas.org/downloads/reports/preference_sensitive.pdf.
14 O’Connor, A.M., Llewellyn-Thomas, H.A., & Flood, A.B. (October 2004). Modifying unwarranted variations in health care: Shared decision making using patient decision aides. A review of the evidence base for shared decision making. Health Affairs - Web Exclusive 63-74. Retrieved July 16, 2010, from http://content.healthaffairs.org/cgi/reprint/hlthaff.var.63v1.
15 Fitch, K. & Iwasaki, I. Patient decision aids and preference sensitive admissions: Opportunity for medical management.