
One of the significant trends in healthcare over the past several years has been the steady increase in health system employment of physicians. In fact, for the first time more physician practices in the U.S. are hospital-owned than physician-owned.[1] As may be expected, this phenomenon has been accelerated in some markets more than others, consistent with regional differences often observed in U.S. healthcare.
In those markets for which there are still a number of independent specialists, astute health systems are sharpening their strategic due diligence efforts to ensure their physician employment decisions are "investment grade."
Employment driver balance
Industry observation suggests that physician employment has historically been largely driven by health system strategy. These strategies have generally coalesced around one of four general rationales:
Lately, an increasing push for employment has come from physicians, driven by a fundamental shift in the underlying business model of their practices. Some of these key drivers include:
Source: CMS; FTI analysis
Tough questions, Tough choices
The confluence of factors mentioned above has coincided with many health systems recently finding themselves inundated with competing requests from physician groups interested in exploratory employment discussions. Frequently, this involves several competing groups within a single specialty. In some cases, these overtures may represent an "about face" for physician groups that have historically stressed their desire around remaining independent to health system leaders.
The challenges these situations present to health system leaders include: expending significant management time and focus on evaluating these opportunities, responding to time sensitive opportunities (groups may be in simultaneous discussions with competing health systems) and assessing the financial impact of the additional employment and infrastructure costs on the budget. These issues require health systems to reflect upon a number of critical questions to ensure employment decisions are rational and defensible, which may include:
In some cases, it becomes obvious that a system will not have the bandwidth or desire to employ all physician groups expressing interest. Inevitably, tough choices will have to be made knowing that some physicians may either continue to split cases or ultimately become employees of competitors. Therefore, it will benefit health system leadership to develop a structured framework for setting direction and making some high-level assessments prior to entering into negotiations. This can help avoid some of the all-too-common employment rationale cited in retrospect, such as the "this was the first group to approach us" or "we had a great initial meeting."
It is important to not become stuck in "reactive mode," or simply delegate negotiations to a single hospital department or individual. Instead, these decisions should involve executive leadership and present a clear link to the organization's strategic plan.
Real world example of deploying A specialist employment "roadmap"
Developing a strategic "roadmap" can aid health systems in proactively assessing employment and alignment opportunities. As with any roadmap, it will have a starting point, destination and general direction. It does not have to be, nor should it be, as detailed as "turn-by-turn" navigation. Rather, it should be flexible enough to be adaptable to a range of future scenarios that may arise.
Such a roadmap should involve the same thought and analytical rigor as any organizational planning process, such as the 5-year strategic plan, the capital allocation process, or to draw parallel to another industry, a portfolio manager's investment decisions. (After all, a health system's "physician portfolio" is often its greatest competitive asset.)
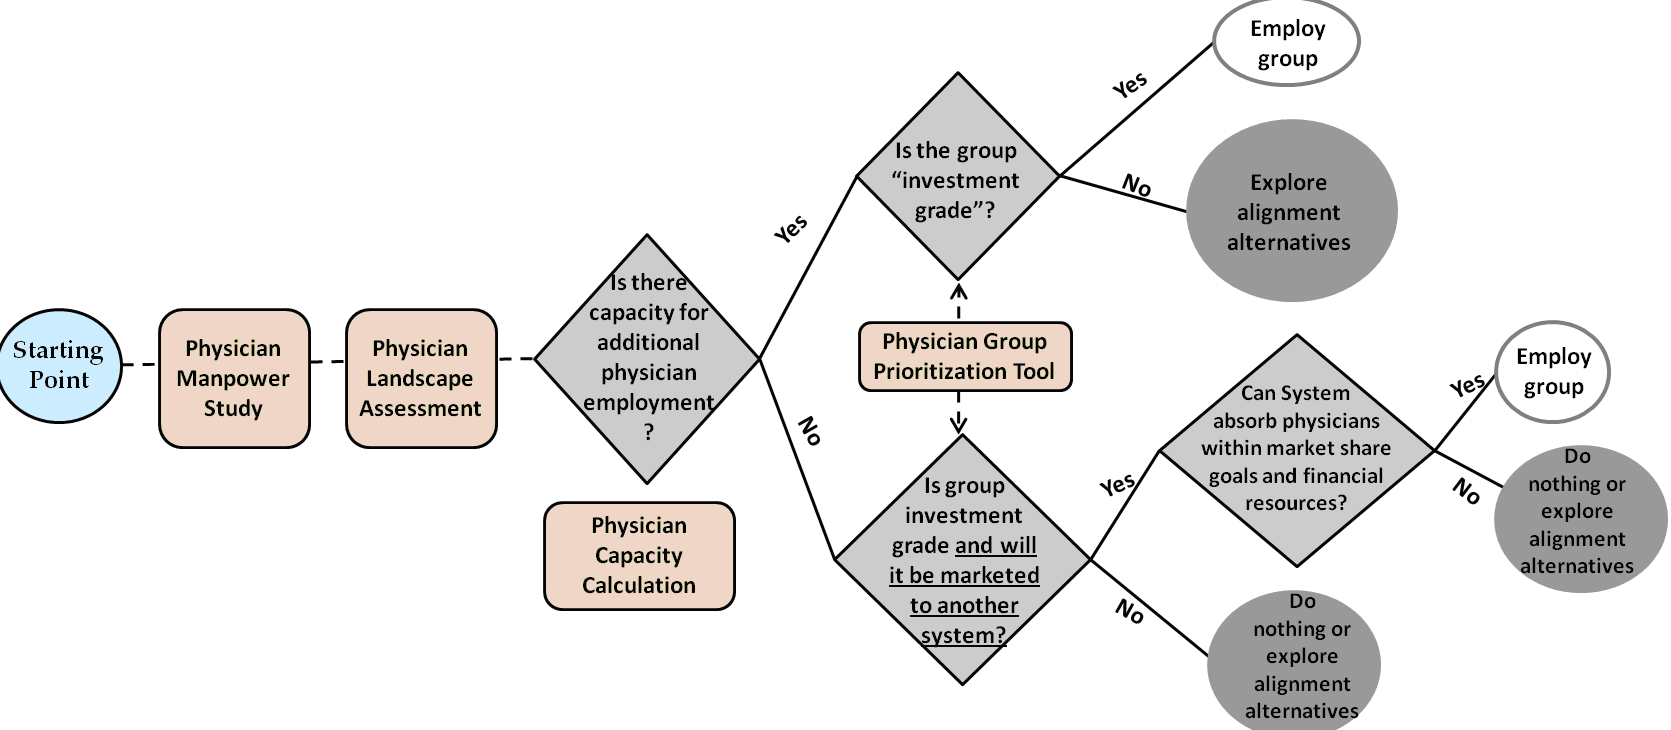
The remainder of this article illustrates such an approach for a hypothetical health system ("System") in a large metro area with several competing health systems. The figure below depicts the overall roadmap and some of the obstacles the System may face.
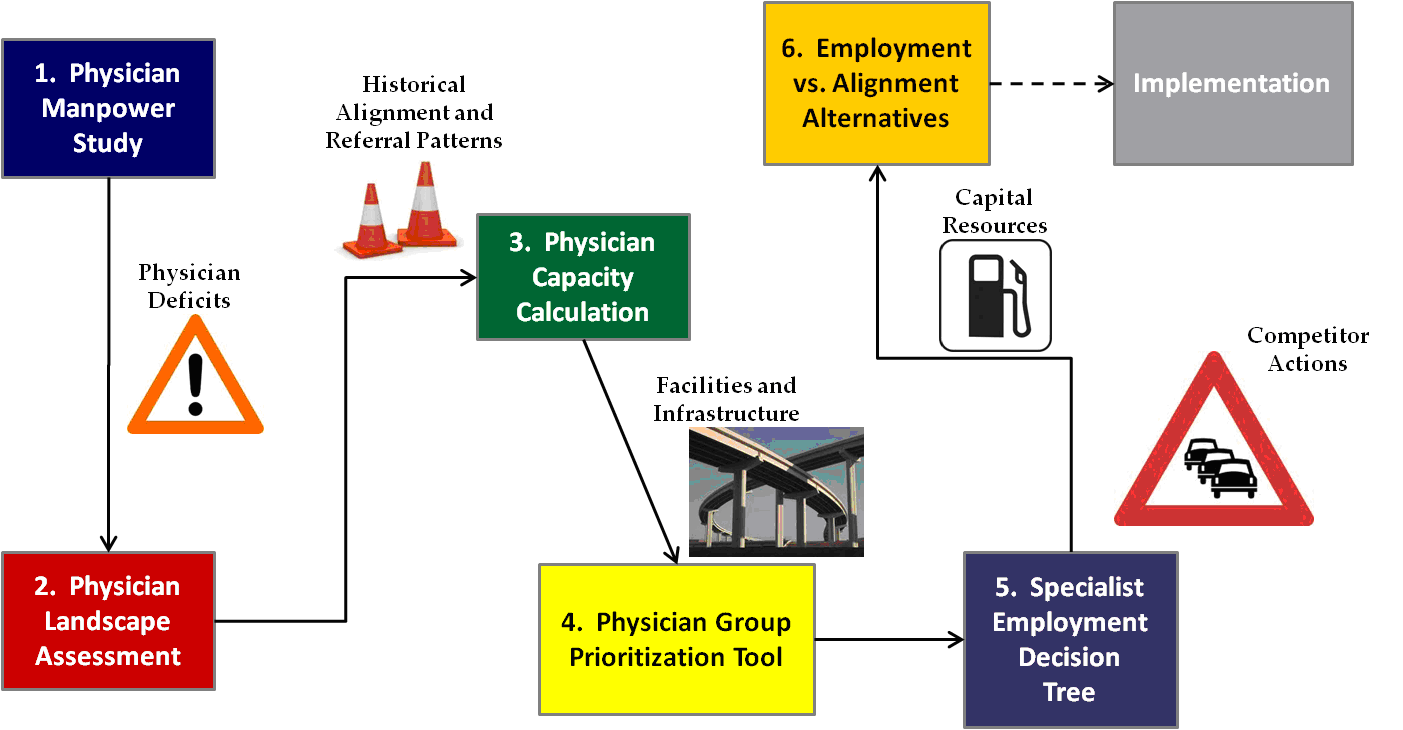
This roadmap can be applied on a specialty-by-specialty basis. To illustrate its applicability in practice, we explore each of its components in order and in more detail. [3]
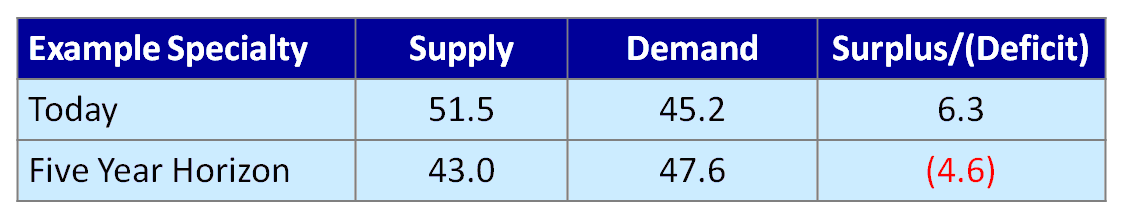
1. Physician manpower study. The physician manpower study has been the established starting point for physician strategy development. It calculates physician full-time equivalent surpluses or deficits for each specialty within a hospital's primary service area by subtracting the estimated demand for physicians from the current or projected supply based on the demographic characteristics of the PSA. (Generally, market-specific, actuarially-based projections are preferable to national physician-to-population ratios, which can vary widely.)
In this example, the physician specialty exhibits a physician surplus today. But given an expected reduction in physician supply due to retirements and increasing demand from an aging population, a physician deficit is expected within the five-year planning horizon.

This tool is helpful in setting the direction for a physician strategy roadmap by identifying:
2. Physician landscape assessment. The physician landscape assessment is basically a taxonomy of existing physician groups in the market and basic intelligence on these practices. This information may largely exist as a mental list among key executives and physician leaders, but health systems increasingly find it helpful to document and continually update this information — especially in larger, fluid markets.
This assessment generally includes the following information on each specialty and practice:
The table below shows a sample summary. Where available, more detailed practice information, such as actual inpatient admissions or surgery/procedure volume, could be displayed in the boxes. In this example, it is worth noting that many employed groups still perform cases at competing systems. This is an illustration of local market nuances and the overall challenges presented by physician practice patterns, even in an employed model.

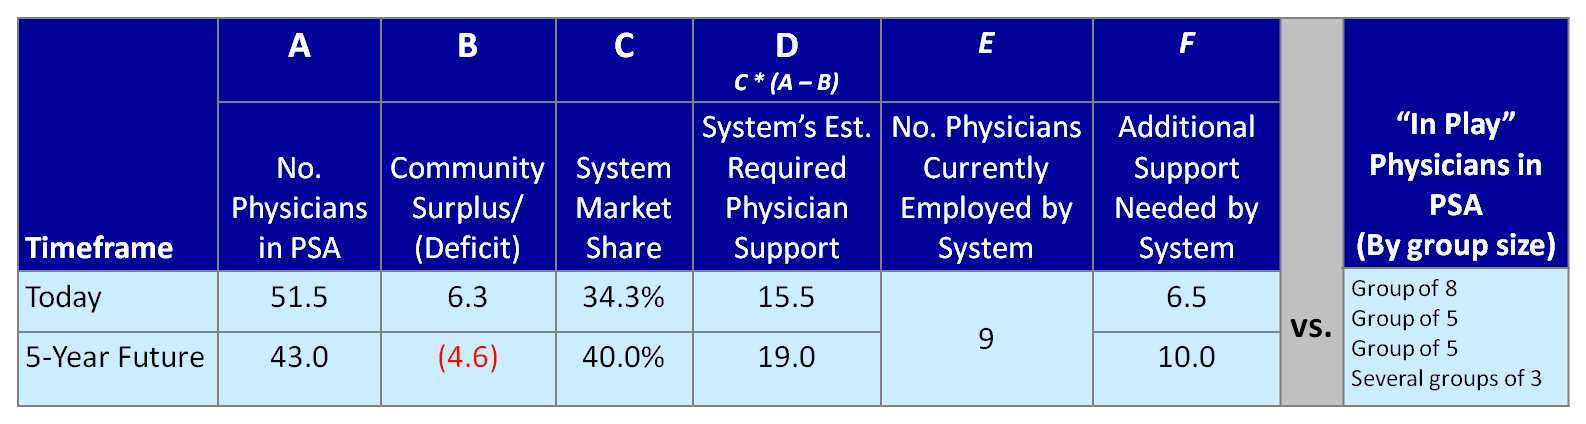
3. Physician capacity calculation. The physician capacity calculation can be used to assess the System’s level of physician support needed by applying market share targets by service line to the Physician Manpower Study results. This can help avoid over-extending employment offers beyond that which the market dictates.
The figure below shows that the hypothetical System's required physician support (at 100 percent loyalty) for a given specialty is 15.5 FTEs today, and 19.0 five years from now, based on demographic growth and market share targets. With nine employed currently, the System's maximum additional physician capacity under current circumstances is 6.5 new physicians today and 10.0 within the five-year window. Therefore, given the landscape of "in play" physicians in the market, the system could employ either a) the largest group of eight, b) two of the groups of five or c) one group of five and several smaller groups, as long as the total did not exceed 10.0 newly employed physician FTEs.
Employing physicians beyond the future capacity of 10.0 would create the risk of over-extending resources. In theory, incremental employment beyond this threshold could in turn increase future market share, thus justifying additional employment. However, caution should be exercised in readjusting market share targets to justify employment given that:
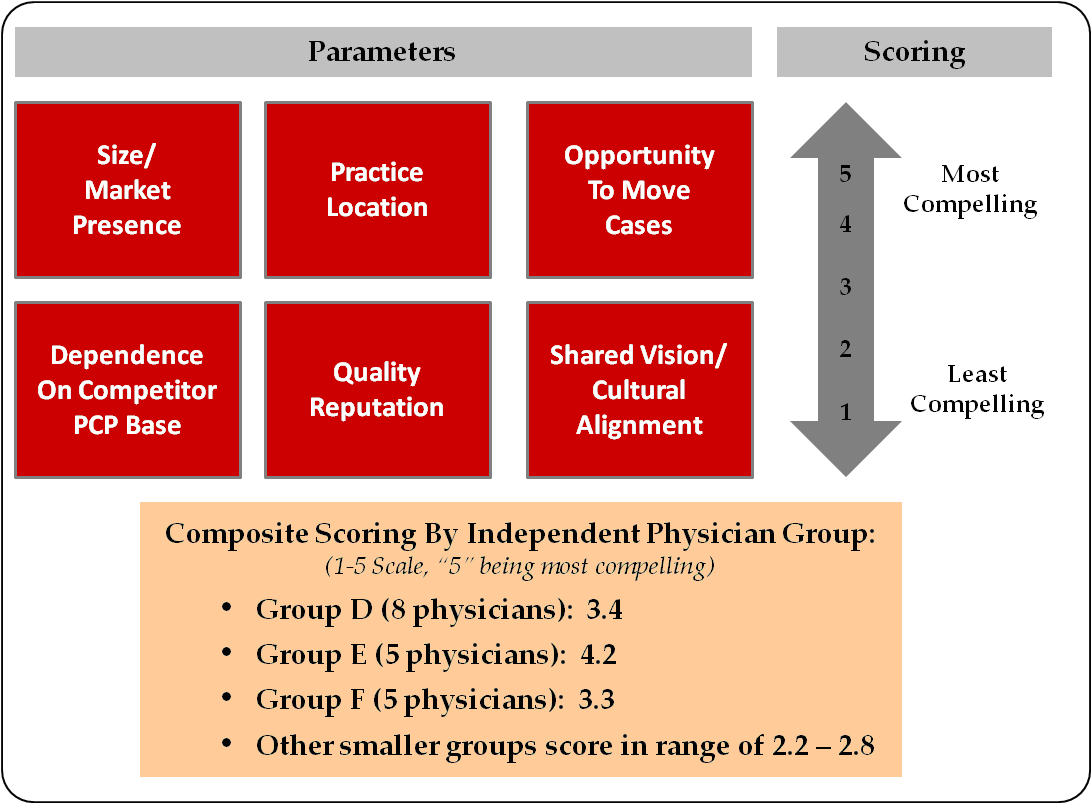
4. Physician group prioritization tool. The physician group prioritization tool provides an analytical framework with which to evaluate competing employment opportunities among multiple physician groups within a single specialty. It can be applied to all physician groups within a specialty (regardless of current practice patterns or employment status).
Such a tool may involve scoring groups along several quantitative and qualitative dimensions. Calculating a "composite score" may be helpful in terms of ranking groups for employment, but should be used more to stimulate discussion, rather than make definitive decisions.
In the example below, physician groups were evaluated with respect to the following:
5. Specialist employment decision tree. The specialist employment decision tree puts the aforementioned tools into action. It can be applied on a specialty-by-specialty basis, starting with the highest priority physician group in each specialty. The decision tree is intended to be applied only after developing the tools described above.
The top branch is designed to require physician employment decisions to pass two critical hurdles: 1) group size vs. System capacity for employment, and 2) a group's "investment worthiness." The lower branch comes into play for defensive situations in which employment capacity may not exist within existing parameters, but an employment offer from a competitor may threaten the System’s
service line sustainability.
In carrying forward our example, we would start with the five-physician Group E, since it had the highest score of 4.2. Given that we calculated the upper capacity limit for additional employed physicians at 10.0 within the planning period, it makes sense to explore employment with that group first. Assuming successful employment negotiations, the new capacity would be 5.0 (10.0 capacity minus the 5.0 new Group E FTEs that will be employed). The next logical group would be the five-physician Group F, since there appears not to be enough capacity to realistically employ eight-physician Group D, and Group F scores the highest among remaining groups of five physicians or fewer.
This process does not necessarily preclude entering into employment discussions with multiple groups at the same time, but rather it demonstrates likely trade-offs and downstream effects of employing one group over another. In essence, a system’s employment action inherently alters the physician landscape in the market, and thus alters future employment options.
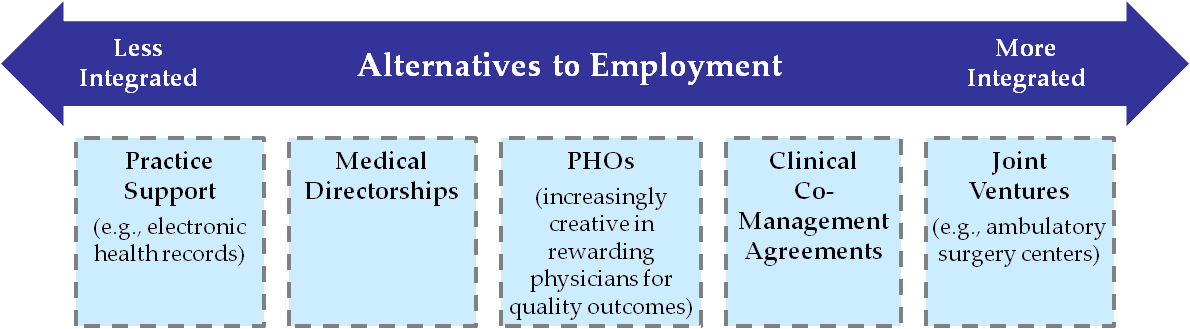
6. Employment vs. alignment alternatives. Not every physician group evaluated with these tools will pass the hurdles for employment. Yet, the evaluation and discussion process may lead to alternatives to employment that could enhance the symbiotic relationship between a health system and a physician group. While many markets are seeing full employment relationships outpacing other alignment vehicles, a number of alternatives, as shown in Figure 7 below, appear to remain popular in many markets.
Concluding thoughts
Once intent to employ a particular group has been established, there are a number of activities that should be conducted, including but not limited to:
For many organizations, past employment decisions have been based on personal relationships and a "gut feel." The roadmap is a guided, disciplined approach (or "gut check") to assess physician alignment decisions within the greater context of the market and the health system’s unique characteristics.
Ryan E. Ross is a Director at FTI Consulting in the Healthcare Strategy & Planning practice. He can be reached at ryan.ross@fticonsulting.com or (317) 846-8486.
Footnotes:
[3] The numerical values are for illustrative purposes only, rather than actual data.
In those markets for which there are still a number of independent specialists, astute health systems are sharpening their strategic due diligence efforts to ensure their physician employment decisions are "investment grade."
Employment driver balance
Industry observation suggests that physician employment has historically been largely driven by health system strategy. These strategies have generally coalesced around one of four general rationales:
- Offensive. To support volume growth initiatives through pursuit of "splitter" physicians, new services/sub-specialties and new geographies.
- Defensive. To protect existing referral sources from competing health systems targeting a hospital's medical staff and service area.
- Coverage. To ensure specialist and sub-specialist availability that would be challenging to secure through other means.
- Business model transformation. To prepare for new models of clinical delivery and reimbursement by enhancing clinical coordination.
Lately, an increasing push for employment has come from physicians, driven by a fundamental shift in the underlying business model of their practices. Some of these key drivers include:
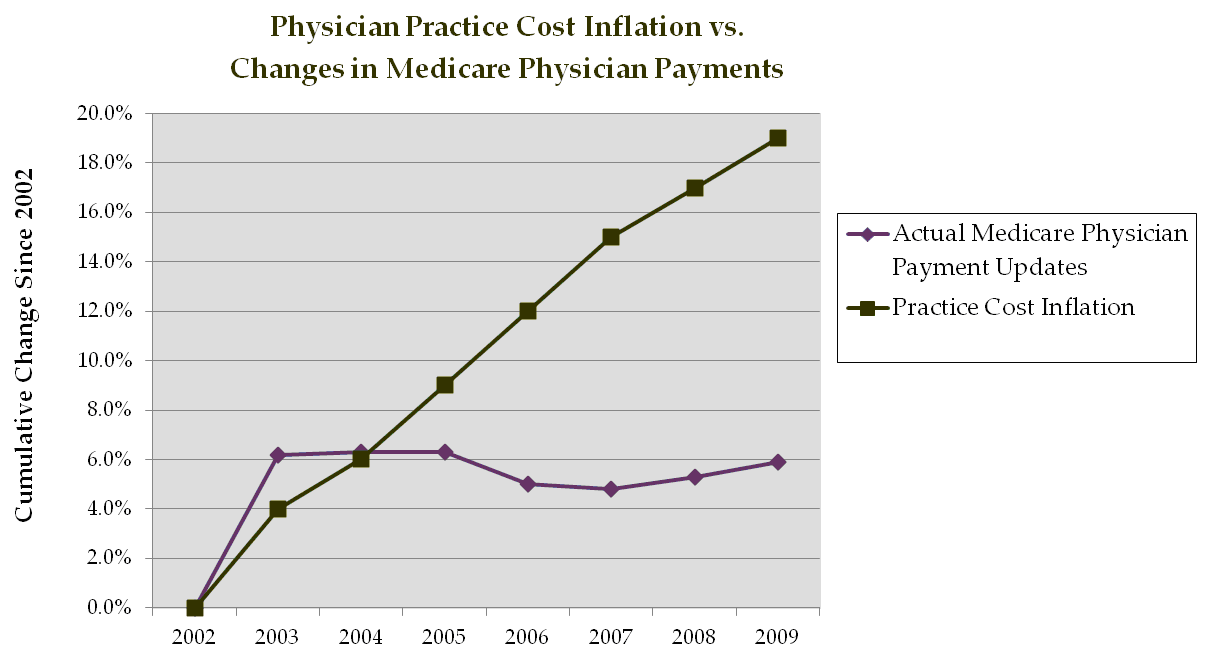
- Changes in reimbursement. Medicare's sharp cuts in recent years, which are often followed by similar commercial payor actions, have hit specialists especially hard (e.g., cardiology and gastroenterology).
- Increasing complexity and cost of operating a physician practice. This includes increased regulations, impacts of Healthcare Reform, information technology costs and staffing needs.
- Physician aging. As the national physician age increases (today more than 45 percent of physicians are age 55+ compared to just 36.9 percent in 2000[2]), established physicians increasingly seek income guarantees and exit strategies.
- Next generation physician dynamics. Many physicians recently out of residency seek the increased predictability that employment brings with respect to patient volumes, compensation and time commitments.
Source: CMS; FTI analysis
Tough questions, Tough choices
The confluence of factors mentioned above has coincided with many health systems recently finding themselves inundated with competing requests from physician groups interested in exploratory employment discussions. Frequently, this involves several competing groups within a single specialty. In some cases, these overtures may represent an "about face" for physician groups that have historically stressed their desire around remaining independent to health system leaders.
The challenges these situations present to health system leaders include: expending significant management time and focus on evaluating these opportunities, responding to time sensitive opportunities (groups may be in simultaneous discussions with competing health systems) and assessing the financial impact of the additional employment and infrastructure costs on the budget. These issues require health systems to reflect upon a number of critical questions to ensure employment decisions are rational and defensible, which may include:
- Is this consistent with our strategic plan?
- How do we prioritize among competing physician opportunities?
- How do such decisions fit with our strategic service line efforts?
- What is the expected return on investment?
- Does capacity exist to realize the ROI?
- External: Market demand and referral patterns
- Internal: Physical capacity and infrastructure
- Are the physician groups "investment grade?"
- Are there better alternatives to employment with respect to some groups?
In some cases, it becomes obvious that a system will not have the bandwidth or desire to employ all physician groups expressing interest. Inevitably, tough choices will have to be made knowing that some physicians may either continue to split cases or ultimately become employees of competitors. Therefore, it will benefit health system leadership to develop a structured framework for setting direction and making some high-level assessments prior to entering into negotiations. This can help avoid some of the all-too-common employment rationale cited in retrospect, such as the "this was the first group to approach us" or "we had a great initial meeting."
It is important to not become stuck in "reactive mode," or simply delegate negotiations to a single hospital department or individual. Instead, these decisions should involve executive leadership and present a clear link to the organization's strategic plan.
Real world example of deploying A specialist employment "roadmap"
Developing a strategic "roadmap" can aid health systems in proactively assessing employment and alignment opportunities. As with any roadmap, it will have a starting point, destination and general direction. It does not have to be, nor should it be, as detailed as "turn-by-turn" navigation. Rather, it should be flexible enough to be adaptable to a range of future scenarios that may arise.
Such a roadmap should involve the same thought and analytical rigor as any organizational planning process, such as the 5-year strategic plan, the capital allocation process, or to draw parallel to another industry, a portfolio manager's investment decisions. (After all, a health system's "physician portfolio" is often its greatest competitive asset.)
The remainder of this article illustrates such an approach for a hypothetical health system ("System") in a large metro area with several competing health systems. The figure below depicts the overall roadmap and some of the obstacles the System may face.
This roadmap can be applied on a specialty-by-specialty basis. To illustrate its applicability in practice, we explore each of its components in order and in more detail. [3]
1. Physician manpower study. The physician manpower study has been the established starting point for physician strategy development. It calculates physician full-time equivalent surpluses or deficits for each specialty within a hospital's primary service area by subtracting the estimated demand for physicians from the current or projected supply based on the demographic characteristics of the PSA. (Generally, market-specific, actuarially-based projections are preferable to national physician-to-population ratios, which can vary widely.)
In this example, the physician specialty exhibits a physician surplus today. But given an expected reduction in physician supply due to retirements and increasing demand from an aging population, a physician deficit is expected within the five-year planning horizon.
This tool is helpful in setting the direction for a physician strategy roadmap by identifying:
- The magnitude of projected physician surplus or deficits by specialty;
- Patient access considerations;
- Leverage that existing groups within each specialty may have based on market supply and demand;
- Specialties for which succession planning may be more meaningful than practice acquisition, given high average age of physicians; and
- The degree to which a market could absorb new physicians without negatively impacting volumes of existing practices.
2. Physician landscape assessment. The physician landscape assessment is basically a taxonomy of existing physician groups in the market and basic intelligence on these practices. This information may largely exist as a mental list among key executives and physician leaders, but health systems increasingly find it helpful to document and continually update this information — especially in larger, fluid markets.
This assessment generally includes the following information on each specialty and practice:
- Physician group name, location, physician names and ages;
- Current affiliations, including employment, joint ventures, ACO participation, etc.;
- General percent of volumes/practice time devoted to each health system within the market (may involve quantitative data from state market share reports, or qualitative market intelligence);
- Recent practice changes, additions, departures; and
- Summary of recent discussions the System has had with each group (as applicable), and identification of System liaison.
The table below shows a sample summary. Where available, more detailed practice information, such as actual inpatient admissions or surgery/procedure volume, could be displayed in the boxes. In this example, it is worth noting that many employed groups still perform cases at competing systems. This is an illustration of local market nuances and the overall challenges presented by physician practice patterns, even in an employed model.
3. Physician capacity calculation. The physician capacity calculation can be used to assess the System’s level of physician support needed by applying market share targets by service line to the Physician Manpower Study results. This can help avoid over-extending employment offers beyond that which the market dictates.
The figure below shows that the hypothetical System's required physician support (at 100 percent loyalty) for a given specialty is 15.5 FTEs today, and 19.0 five years from now, based on demographic growth and market share targets. With nine employed currently, the System's maximum additional physician capacity under current circumstances is 6.5 new physicians today and 10.0 within the five-year window. Therefore, given the landscape of "in play" physicians in the market, the system could employ either a) the largest group of eight, b) two of the groups of five or c) one group of five and several smaller groups, as long as the total did not exceed 10.0 newly employed physician FTEs.
Employing physicians beyond the future capacity of 10.0 would create the risk of over-extending resources. In theory, incremental employment beyond this threshold could in turn increase future market share, thus justifying additional employment. However, caution should be exercised in readjusting market share targets to justify employment given that:
- Physician capacity is only one determinant of volume;
- Return on investment of additional recruitment may be subject to the law of diminishing returns;
- Additional physical capacity may be required (e.g., ORs, cath labs) to realize benefits of additional employment;
- Limited capital may exist for employment and related infrastructure, and must be assessed vis-à-vis needs in other service lines;
- Addition of multiple groups could be challenging from operational, cultural and service line leadership perspectives;
- Competing systems' existing primary care base/referral patterns and patient hospital preferences could limit the effect of realigning their specialist groups; and
- Competing systems may recruit new physicians to the market to retain share, thus shifting the underlying community need and landscape.
4. Physician group prioritization tool. The physician group prioritization tool provides an analytical framework with which to evaluate competing employment opportunities among multiple physician groups within a single specialty. It can be applied to all physician groups within a specialty (regardless of current practice patterns or employment status).
Such a tool may involve scoring groups along several quantitative and qualitative dimensions. Calculating a "composite score" may be helpful in terms of ranking groups for employment, but should be used more to stimulate discussion, rather than make definitive decisions.
In the example below, physician groups were evaluated with respect to the following:
- Size/market presence. Should be calibrated with respect to each unique specialty.
- Practice location. In some instances, proximity to competitors may be more, rather than less, advantageous to capturing new volume.
- Volume opportunity. A high number of cases currently performed outside the system will indicate greater volume opportunity.
- Dependence on competitor PCP base. Full realization of employment may not be captured if a specialist group's cases rely heavily on a competitor-employed PCP base.
- Quality reputation. Measurements may include outcomes at System hospitals, patient satisfaction, use of best practices, electronic health records, etc.; a rating of "fair" or "poor" may be a deal-breaker.
- Shared vision/Cultural alignment. May be most difficult to measure, but consider historical participation in System committees/initiatives/leadership roles.
5. Specialist employment decision tree. The specialist employment decision tree puts the aforementioned tools into action. It can be applied on a specialty-by-specialty basis, starting with the highest priority physician group in each specialty. The decision tree is intended to be applied only after developing the tools described above.
The top branch is designed to require physician employment decisions to pass two critical hurdles: 1) group size vs. System capacity for employment, and 2) a group's "investment worthiness." The lower branch comes into play for defensive situations in which employment capacity may not exist within existing parameters, but an employment offer from a competitor may threaten the System’s
service line sustainability.
In carrying forward our example, we would start with the five-physician Group E, since it had the highest score of 4.2. Given that we calculated the upper capacity limit for additional employed physicians at 10.0 within the planning period, it makes sense to explore employment with that group first. Assuming successful employment negotiations, the new capacity would be 5.0 (10.0 capacity minus the 5.0 new Group E FTEs that will be employed). The next logical group would be the five-physician Group F, since there appears not to be enough capacity to realistically employ eight-physician Group D, and Group F scores the highest among remaining groups of five physicians or fewer.
This process does not necessarily preclude entering into employment discussions with multiple groups at the same time, but rather it demonstrates likely trade-offs and downstream effects of employing one group over another. In essence, a system’s employment action inherently alters the physician landscape in the market, and thus alters future employment options.
6. Employment vs. alignment alternatives. Not every physician group evaluated with these tools will pass the hurdles for employment. Yet, the evaluation and discussion process may lead to alternatives to employment that could enhance the symbiotic relationship between a health system and a physician group. While many markets are seeing full employment relationships outpacing other alignment vehicles, a number of alternatives, as shown in Figure 7 below, appear to remain popular in many markets.
Concluding thoughts
Once intent to employ a particular group has been established, there are a number of activities that should be conducted, including but not limited to:
- Strategic and operational due diligence;
- Financial due diligence;
- Negotiation of terms, including employment terms, purchased goodwill (if any), assets included, continued employment of staff, non-competes, etc.; and
- Expectations around clinical practice, best practices, protocols and clinical IT utilization.
For many organizations, past employment decisions have been based on personal relationships and a "gut feel." The roadmap is a guided, disciplined approach (or "gut check") to assess physician alignment decisions within the greater context of the market and the health system’s unique characteristics.
Ryan E. Ross is a Director at FTI Consulting in the Healthcare Strategy & Planning practice. He can be reached at ryan.ross@fticonsulting.com or (317) 846-8486.
Footnotes:
[1] Physician Compensation and Production Survey, Medical Group Management Association, 2003–2009
[2] The Massachusetts Medical Society 2011 Physician Practice Environment Report, Table 5[3] The numerical values are for illustrative purposes only, rather than actual data.