Current healthcare literature is replete with recommendations for providers who are interested in pursuing participation in accountable care organizations. These articles typically focus on aligning payment incentives, developing care models, designing information systems to report quality measures and identify potential high-cost patients and describing the dire consequences that will befall hospitals that don't participate in ACOs.
Less frequent are articles that describe the financial planning that providers should undertake to understand the financial effects on their organizations of participating in ACOs. These types of analyses will be critical to ensure that provider organizations will be able to withstand the losses in revenue and cash flow that can occur if the ACOs are successful in creating savings.
It's difficult to determine exactly when these revenue reductions occur, since they are related to the absence of the service rather than the occurrence of a service. They occur, however, whenever a patient seeks care from a primary care physician rather than going to an emergency room, when a COPD patient remains on her medications and thereby avoids an admission, when a post-discharge infection that would create a readmission doesn't occur, and in numerous other cases where the ACO's clinical initiatives are successful.
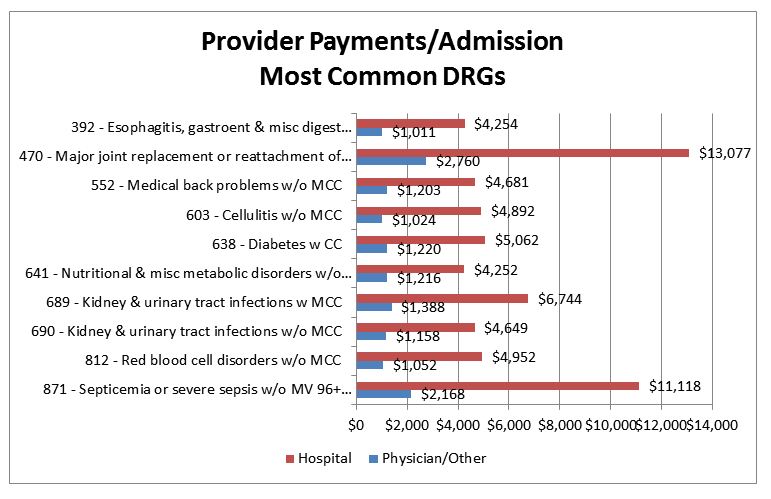
For example, avoidance of an admission for DRG 871 (septicemia) would result in reduced revenue of about $11,000 to the hospital and $2,000 to physicians.
For physicians, the amounts shown can be subdivided by medical specialty. This is shown below for the top providers in selected DRGs from the above table.
The table below shows the revenue loss that would occur for an academic medical center and its associated physicians that was able to achieve a 10 percent reduction in Medicare admissions over a year.
This is not a realistic example, since it's unlikely that reductions in admissions would occur uniformly throughout all DRGs. However, it does give an indication of the magnitude of change in revenue that could occur for individual physician specialties and the hospital as a result of clinical initiatives to reduce inpatient utilization. A situation-specific analysis would utilize actual historical data to compute the historical provider payment per admission for each DRG, and the decrease (or in some cases the increase[2]) in the admission rates in the DRGs most likely to be affected by the clinical initiatives planned by the ACO.
ACO clinical initiatives will also affect other services than admissions. Similar analyses can be performed for anticipated decreases in emergency department visits and other services.
To provide a complete overview of the effects of clinical initiatives on revenue, a comprehensive model must be developed linking the incidences of provider services to those services expected to be reduced or eliminated by the ACO's clinical initiatives. For example, if an initiative to reduce readmissions is established, all provider services related to the targeted readmission type must be identified and their payment effects quantified. Similar data manipulations and calculations will be necessary for services such as emergency department visits that may also be reduced. This modeling process requires integration of the data analytics, financial and clinical team members to develop an accurate projection of the financial effects of these clinical initiatives. This is necessary to estimate the lost revenue to providers, which is then used to compute the shared savings for the ACO. Absent this step, it is difficult to accurately develop any meaningful estimates of the shared savings.
However, another type of ACO can have significantly different financial results. In these ACOs, the services targeted for reduction are provided by providers who are not part of the ACO. An example of this type of ACO would be one developed by primary care physicians. In this ACO, the PCPs would develop clinical initiatives of the type described above that would reduce hospital and specialist utilization. The PCPs would benefit from the shared savings, but because the revenue losses were incurred by other providers (because most inpatient services are not provided by PCPs), the PCPs would not share in this revenue loss. The same situation will occur to a lesser degree with a specialist physician ACO, whose activities would affect the revenue of the specialists but by a lesser extent than it would affect hospital revenue. These ACOs can be highly successful by targeting services provided by other provider types.
Steps in analyzing lost revenue
Footnotes:
[1] This assumes that the savings is shared between the ACO and payer in approximately 50/50 split. In a Medicare ACO saving of more than 50% is necessary, with the difference depending on the number of members in the ACO.
[2] Increases in admissions for some DRGs might be expected if the admissions are for lower-intensity (“without complications”) DRGs that occur because complications were avoided.
Less frequent are articles that describe the financial planning that providers should undertake to understand the financial effects on their organizations of participating in ACOs. These types of analyses will be critical to ensure that provider organizations will be able to withstand the losses in revenue and cash flow that can occur if the ACOs are successful in creating savings.
Why revenue losses occurs
A Medicare ACO that receives (for example) $100,000 in "shared savings" payment must have first reduced utilization in a way that decreased payments to providers by more than $200,000.[1] A Medicare ACO organized by a hospital is likely to incur significant reductions in its own Medicare revenue because reductions in hospital admissions and readmissions are frequent targets of care management programs. These hospitals, along with specialist physicians, should project the effects of these revenue decreases as part of their preparation and due diligence for participation in the ACO.It's difficult to determine exactly when these revenue reductions occur, since they are related to the absence of the service rather than the occurrence of a service. They occur, however, whenever a patient seeks care from a primary care physician rather than going to an emergency room, when a COPD patient remains on her medications and thereby avoids an admission, when a post-discharge infection that would create a readmission doesn't occur, and in numerous other cases where the ACO's clinical initiatives are successful.
Revenue loss from avoided admissions
ACO clinical initiatives encompass many different areas, but this article will focus on avoided admissions, in which the lost revenue is relatively easy to quantify. The graph below shows the average Medicare payments to hospitals and physicians for several of the most common Medicare DRGs. The red bars show the average payment to the hospital, while the blue bars indicate payments to physicians and other Part B providers such as therapists ambulance services, and others. The amounts shown represent the lost revenue for each of those provider groups for each avoided admission in the indicated DRG.For example, avoidance of an admission for DRG 871 (septicemia) would result in reduced revenue of about $11,000 to the hospital and $2,000 to physicians.
For physicians, the amounts shown can be subdivided by medical specialty. This is shown below for the top providers in selected DRGs from the above table.
| 392 - Esophagitis, gastroent & misc digest disorders w/o MCC |
|
| Internal medicine | $232 |
| Emergency medicine |
$138 |
| Diagnostic radiology | $98 |
| Gastroenterology | $81 |
| Cardiology | $29 |
| General surgery | $26 |
| Family practice | $18 |
| Physical medicine and rehabilitation | $17 |
| Pathology | $15 |
| 641 - Nutritional & misc metabolic disorders w/o MCC | ||
| Internal medicine | $303 |
|
| Emergency medicine | $138 | |
| Gastroenterology |
|
|
| Diagnostic radiology | $63 |
|
| Physical medicine and rehabilitation | $38 | |
| Nephrology | $33 | |
| Cardiology | $33 | |
| Neurology |
$13 | |
| Family practice |
$12 |
| 871 - Septicemia or severe sepsis w/o MV 96+ hours w MCC | |
| Internal medicine |
$636 |
| Emergency medicine | $159 |
| Diagnostic radiology | $116 |
| Critical care (intensivists) |
$94 |
| Pulmonary disease |
$75 |
| Cardiology | $75 |
| Gastroenterology | $60 |
| Nephrology | $55 |
| Infectious disease |
$54 |
The table below shows the revenue loss that would occur for an academic medical center and its associated physicians that was able to achieve a 10 percent reduction in Medicare admissions over a year.
| Specialty | Lost Revenue |
| Hospital | $6,919,478 |
| Internal medicine | $261,443 |
| Cardiology |
$258,688 |
| Emergency medicine | $111,065 |
| Diagnostic radiology |
$101,542 |
| General surgery |
$81,545 |
| Orthopedic surgery | $59,731 |
| Anesthesiology | $53,111 |
| Gastroenterology | $48,065 |
| Critical care (intensivists) | $40,748 |
| Pulmonary disease | $38,482 |
| Physical medicine and rehabilitation | $38,435 |
| Nephrology |
$36,144 |
| Neurology | $24,411 |
| Vascular surgery |
$23,631 |
| Pathology | $19,631 |
| Cardiac surgery | $18,446 |
| Neurosurgery | $17,006 |
| Thoracic surgery | $15,951 |
| Hematology/oncology |
$13,644 |
This is not a realistic example, since it's unlikely that reductions in admissions would occur uniformly throughout all DRGs. However, it does give an indication of the magnitude of change in revenue that could occur for individual physician specialties and the hospital as a result of clinical initiatives to reduce inpatient utilization. A situation-specific analysis would utilize actual historical data to compute the historical provider payment per admission for each DRG, and the decrease (or in some cases the increase[2]) in the admission rates in the DRGs most likely to be affected by the clinical initiatives planned by the ACO.
ACO clinical initiatives will also affect other services than admissions. Similar analyses can be performed for anticipated decreases in emergency department visits and other services.
Cash flow implications
Under most ACO arrangements, including Medicare, some of the lost revenue shown above would be returned to ACO participants as shared savings. However, this repayment would not occur until some future date — perhaps years in the future after all claims for the covered population have been received, paid and reconciled with the shared savings targets. Therefore, providers need to develop plans to maintain cash flow throughout that period.ACOs with non-Medicare payors
The above analysis shows hypothetical examples of the types of revenue reductions that could occur in a Medicare ACO. The actual results will depend on the clinical initiatives undertaken, and their effectiveness. Furthermore this analysis utilizes the Medicare payment rates and methodologies (i.e., DRG payment for hospital inpatient services; RBRBS payment for physician services), which may differ from those used by commercial payors. Therefore, it will be important for provider participants in an ACO to carefully model the effects of their planned clinical initiatives utilizing the contracting payor's payment methodology and rates to ascertain the effect of those initiatives on provider revenue.Data requirements for comprehensive analysis
This process highlights the importance of obtaining comprehensive historical data from the payor from which these types of calculations can be computed. Most provider organizations do not have access to comprehensive payment data across provider types that are sufficiently complete to perform these calculations. For example, billing data from physician organizations generally is not coded with the DRG of the inpatient stay, making it difficult to relate these physician services to a particular type of avoided admission.To provide a complete overview of the effects of clinical initiatives on revenue, a comprehensive model must be developed linking the incidences of provider services to those services expected to be reduced or eliminated by the ACO's clinical initiatives. For example, if an initiative to reduce readmissions is established, all provider services related to the targeted readmission type must be identified and their payment effects quantified. Similar data manipulations and calculations will be necessary for services such as emergency department visits that may also be reduced. This modeling process requires integration of the data analytics, financial and clinical team members to develop an accurate projection of the financial effects of these clinical initiatives. This is necessary to estimate the lost revenue to providers, which is then used to compute the shared savings for the ACO. Absent this step, it is difficult to accurately develop any meaningful estimates of the shared savings.
ACO winners and losers
The above example assumes a hospital/specialist–based ACO, in which the ACO's activities affect the utilization (and hence the revenue) of the ACO's constituent providers. These types of organizations will find it difficult to create sufficient shared savings to cover the loss in revenue, because the payor is also sharing in the revenue that is lost. Therefore the provider's shared savings payments will be lower than the lost revenue by the amount of shared savings going to the payor.However, another type of ACO can have significantly different financial results. In these ACOs, the services targeted for reduction are provided by providers who are not part of the ACO. An example of this type of ACO would be one developed by primary care physicians. In this ACO, the PCPs would develop clinical initiatives of the type described above that would reduce hospital and specialist utilization. The PCPs would benefit from the shared savings, but because the revenue losses were incurred by other providers (because most inpatient services are not provided by PCPs), the PCPs would not share in this revenue loss. The same situation will occur to a lesser degree with a specialist physician ACO, whose activities would affect the revenue of the specialists but by a lesser extent than it would affect hospital revenue. These ACOs can be highly successful by targeting services provided by other provider types.
Summary
This article has described the issues involved with estimating provider revenue that will be lost through the implementation of care management programs developed by an ACO. For providers that are the targets of such programs, it will be important to estimate the financial effects of these initiatives, and assure that the organizations have sufficient financial strength to weather the effects of these initiatives.Steps in analyzing lost revenue
- Assess the impact of clinical initiatives on admissions by DRG. Most clinical initiatives, especially those directed chronic conditions, have an objective of reducing admissions in the respective clinical area. If successful, care management programs for congestive heart failure will impact the number of admissions for DRGs 291 through 293, while programs to manage COPD will impact admissions in DRGs 190 through 192 and potentially others. The specific DRGs expected to be impacted by these programs should be identified.
- Estimate the effectiveness of these initiatives in reducing admissions. These types of estimates are difficult, but generally the vendors or consultants associated with these programs have developed some estimate as to their cost–savings effectiveness. Since cost savings is achieved from reductions in provider payments, the same estimates of utilization decreases can be used for this purpose.
- Identify the provider payments for these DRGs. When the relevant DRGs have been identified, provider payments can then be determined. For hospital Medicare payments, the calculation is relatively simple, since hospitals are paid on a DRG basis. For other types of payment it may be necessary to extract information from hospital billing records and consolidate the relevant payment information by DRG. For physician services, access to data that includes the services will be necessary. The physician services provided coincident to the admissions in these DRGs must be identified and the related payments must be determined.
- Combining the decrease in admissions with the provider payment per admission, compute the decrease in provider revenue. Using the above information the decrease in provider revenue can easily be computed from by multiplying the number of lost admissions by the provider revenue per admission.
- Repeat for other clinical services. ACO clinical initiatives frequently target reductions in emergency department services, along with decreases in certain types of post-acute services. Lost revenue in these areas is more complex to compute.
Footnotes:
[1] This assumes that the savings is shared between the ACO and payer in approximately 50/50 split. In a Medicare ACO saving of more than 50% is necessary, with the difference depending on the number of members in the ACO.
[2] Increases in admissions for some DRGs might be expected if the admissions are for lower-intensity (“without complications”) DRGs that occur because complications were avoided.
More Articles by Jonathan Pearce:
Financial Advantages Under ACO Model Only Possible With Reduced Payments to Providers?
Post-Discharge Services Create New Challenges for Medicare Bundled Payment Participants