
Healthcare purchasing decisions are akin to ordering wine. That's a problem. Here's why.
Showing great wisdom, our moms cautioned us to never judge a book by its cover. Yet, when we purchase wine we look for the fancy label design, interesting back label story or colorful capsule covering the cork. That said, most wine drinkers use price as the most important indicator of wine quality. Surely a $100 wine must be better than a $15 bottle, otherwise why would the retailer charge more for it?
In the absence of understandable, easily accessible quality metrics, we utilize price as a surrogate for quality. Sure, we may search reviews looking to see if the pretty label represents a 90+ point wine, but in the heat of the moment in a restaurant, we read the wine list left to right choosing a wine by its price rather than its pedigree. Frankly, most consumers employ this approach when they purchase products where quality and value are difficult to judge or trusted quality information is unavailable.
As we move to value-based reimbursement models where price matters, linking quality to price becomes more important than ever. The passage of the Patient Protection and Affordable Care Act dramatically changed the healthcare marketplace and the economics driving it. No longer could provider organizations indiscriminately raise prices to increase revenue and cover their costs. The PPACA set rules strongly encouraging provider organizations to take on risk and deliver measurable quality of care.
For example, hospitals no longer receive reimbursement for Medicare beneficiaries readmitted within 30 days for the same condition. Additionally, the PPACA incented the formation of accountable care organizations, whether for Medicare/Medicaid or group health beneficiaries, which require these organizations to accept financial risk for patient care. Under this environment both quality and cost matter like never before.
An $8 hospital bill
Recent reports from New York State and detailed in The New York Times show how variable and out of control healthcare costs are. The report listed hospitals with their charges and costs for a variety of conditions during the period 2009 to 2011. According to The New York Times article:
In 2011, prices ranged from the $8 bill at Benedictine Hospital in Kingston, N.Y., for treating a case of gastritis (cost: $2), to a $2.8 million charge for a blood disorder case at University Hospital of Brooklyn that cost it $918,462.1
Without even knowing the details of the case, it is hard to believe the $8 bill for gastritis is correct and the cost of the treatment was only $2. If the gastritis case lacks credibility, the same must be said for the blood disorder case.
Without knowing the actual costs of care and the quality of clinical outcomes delivered, organizations fly blind in their effort to deliver affordable, high quality healthcare. With healthcare costs approaching 20 percent of GDP, this blind approach to healthcare delivery fails to meet the needs of a changing and increasingly competitive global economy and hampers our ability to compete internationally for business.
Although supply chain software improved our ability to track supplies used in patient care, the ability of existing applications to track staff members, who represent upwards of 60 percent of the cost of care, uses research assumptions rather than actual data to measure staff costs. These assumptions derive from expert panel recommendations that are generalized to very different institutions, clinical professionals and variations in patient mix.
The demands of value-base reimbursement requires new, episode of care driven cost monitoring tools that take advantage of existing data sources to more accurately measure the impact of professional services on the cost of care. Fortunately, the expansion in the use of electronic medical records provides a valuable data set for use by such a tool. This cost monitoring tool effectively leverages existing data sets created through the use of transactional systems and produce results that represent the actual cost of care.
Cost and quality unlinked
To test the hypothesis that cost and quality are unlinked, Medicare cost and patient satisfaction data were analyzed to look for relationships between cost, number of procedures performed and patient satisfaction. The cohort of 427,207 patients represented those undergoing either knee or hip replacement surgery in 2012 at 2,750 reporting U.S. hospitals. Patient satisfaction was measured by whether the "patient would definitely recommend hospital."2
Although true clinical outcomes provide a medically more meaningful connection to care quality, all hospitals utilize patient satisfaction scores such as patients recommending the hospital in their quality assessment metrics. In lieu of using the more difficult to collect clinical outcomes, the more standard patient satisfaction outcome noted above was used in this analysis.
Running simple correlation statistical analysis on this data set revealed the following:
- Correlation between patient satisfaction and annual number of procedures done = +0.345
- Correlation between patient satisfaction and average cost per case = -0.113
- Correlation between average cost per case and number of procedures done = -0.073
This analysis shows a pattern where the greater the number of procedures a hospital performs, the higher the level of patient satisfaction. In contrast, the cost of the procedure is not related and even a bit negatively related to patient satisfaction. The same result applies to the relationship between average cost per case and number of procedures done.
Country comparisons
Looking at Organization for Economic Co-Development data shows similar results. Of all OECD countries, the U.S. spends the most per capita.3 The chart below shows a sampling of that data:
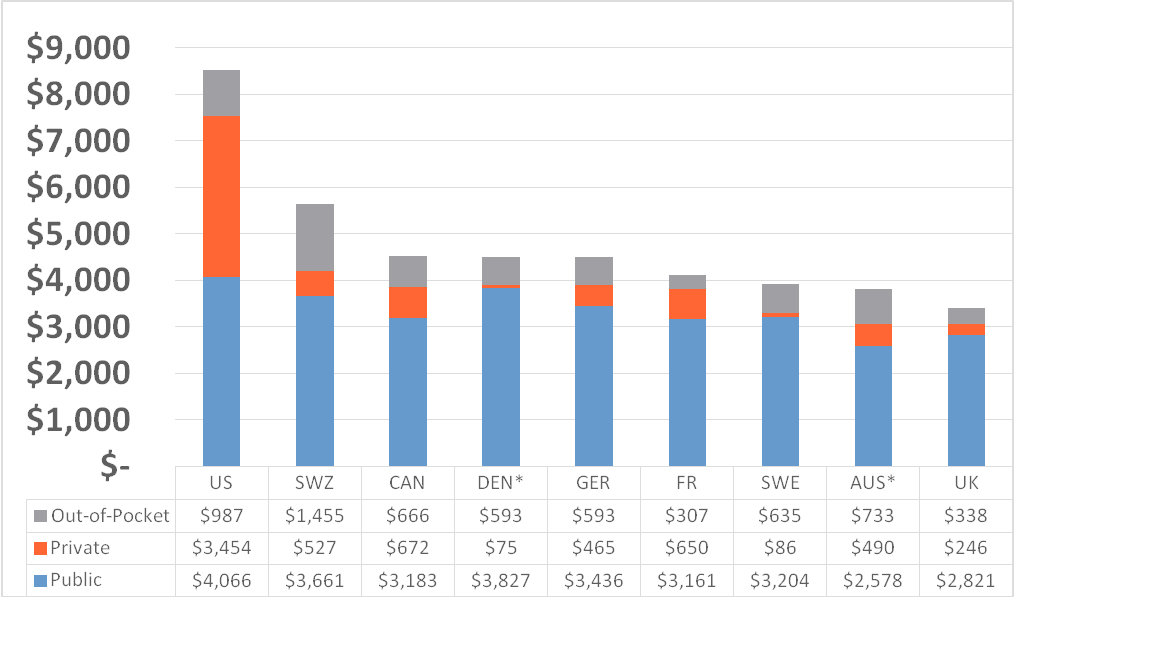
Although the U.S. spends the most per capita, we do not obtain proper value for all the resources devoted to healthcare. First and foremost, healthcare should prevent premature death. Yet, when the Commonwealth Fund analyzed this data in 2011, they found that the U.S. is worst at preventing death among citizens under 75 years of age.4 The chart below shows how poorly our healthcare system performs.
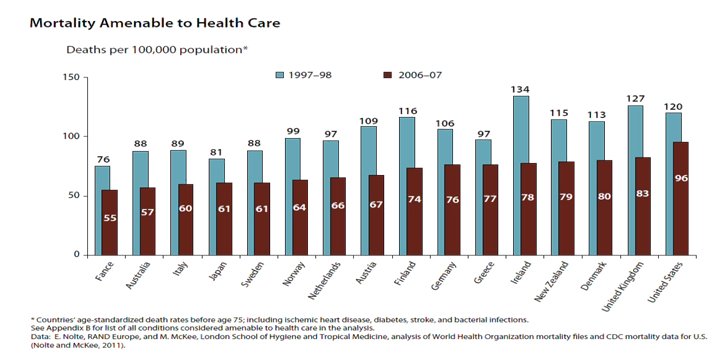
Source: Commonwealth Fund National Scorecard on U.S. Health System Performance, 2011.
Time for a change
The examples above clearly demonstrate that spending more does not lead to better clinical outcomes. Surely there exists a minimum level of expenditure, whether per capita or per procedure, that is necessary to achieve good outcomes, but the value linkage between cost and quality decreases significantly beyond a certain point. Guessing where that point is only recycles the trap where we believe that more expensive care must be better care. Only by measuring the actual cost of care and linking it to meaningful clinical outcomes can we be sure that we are obtaining value from our healthcare expenditures. Analytics provides a tool for us to use to understand what provides value and what is wasteful.
In addition, we must better coordinate care to eliminate duplicative and unnecessary tests, procedures, medications, admissions, and office visits. There is much to be done to improve our healthcare system. We have the tools. We just need to start intelligently applying them. Doing more is a dangerous and wasteful option that must be discarded. It is time to spend wisely
Dr. Barry Chaiken is the chief medical information officer of Infor. With more than 20 years of experience in medical research, epidemiology, clinical information technology and patient safety, Dr. Chaiken is board certified in general preventive medicine and public health and is a Fellow, former Board member, and Chair of HIMSS. As founder of DocsNetwork, Ltd., he worked on quality improvement studies, health IT clinical transformation projects and clinical investigations for the National Institutes of Health, UK National Health Service, and Boston University Medical School. He is currently adjunct professor at Boston University’s School of Management where he teaches informatics. He may be contacted at barry.chaiken@infor.com.
1 Bernstein, N. (2013, December 9). New York state hospital data exposes big markups, and odd bargains. The New York Times. Available at http://www.nytimes.com/2013/12/10/nyregion/new-york-state-hospital-cost-data-expose-big-markups-and-odd-bargains.html?hpw&rref=health&_r=0
2 Centers for Medicare & Medicaid Services (April 16, 2014). Official Hospital Compare Data, Retrieved May 7, 2014, from https://data.medicare.gov/data/hospital-compare/Patient%20Survey%20Results
3 The Organisation for Economic Co-operation and Development (October 11, 2013). Total expenditure on health per capita, Retrieved May 7, 2014, from http://www.oecd-ilibrary.org/social-issues-migration-health/total-expenditure-on-health-per-capita_20758480-table2
4 The Commonwealth Fund Commission on a High Performance Health System (October 2011). Why Not the best?: Results from the national scorecard on U.S. health system performance, 2011, Retrieved May 7, 2014, from http://www.commonwealthfund.org/~/media/Files/Publications/Fund%20Report/2011/Oct/1500_WNTB_Natl_Scorecard_2011_web_v2.pdf